Shoe Print (cm) 28.8 29.5 24.5 28.2 모 24.2 168.4 32.5 31.1 Foot Length (cm) 25.7 28.6 183.5 26.1 176.9 Height (cm) 172.4 173.2 Construct a scatterplot. Choose the correct graph below. OA. Ов. B. Oc. OD. 200- 200- 200- 200- 160- 160+ 160- 160+ 25 Shoe Print (cm) 35 35 35 25 Shoe Print (cm) 25 Shoe Print (cm) 25 Shoe Print (cm) 35 The linear correlation coefficient r is ]. (Round to three decimal places as needed.) Determine the null and alternative hypotheses. Họ: P H,: p (Type integers or decimals. Do not round.) The test statistic is O (Round to two decimal places as needed.) The P-value is D. (Round to three decimal places as needed.) Because the P-value of the linear correlation coetficient is the significance level, there |sufficient evidence to support the claim that there is a linear correlation between shoe print lengths and heights of males. Based on these results, does it appear that police can use a shoe print length to estimate the height of a male? O A. Yes, because shoe print length and height do not appear to be correlated. O B. No, because shoe print length and height appear to be correlated. O. Yes, because shoe print length and height appear to be correlated. OD. No, because shoe print length and height do not appear to be correlated.
Shoe Print (cm) 28.8 29.5 24.5 28.2 모 24.2 168.4 32.5 31.1 Foot Length (cm) 25.7 28.6 183.5 26.1 176.9 Height (cm) 172.4 173.2 Construct a scatterplot. Choose the correct graph below. OA. Ов. B. Oc. OD. 200- 200- 200- 200- 160- 160+ 160- 160+ 25 Shoe Print (cm) 35 35 35 25 Shoe Print (cm) 25 Shoe Print (cm) 25 Shoe Print (cm) 35 The linear correlation coefficient r is ]. (Round to three decimal places as needed.) Determine the null and alternative hypotheses. Họ: P H,: p (Type integers or decimals. Do not round.) The test statistic is O (Round to two decimal places as needed.) The P-value is D. (Round to three decimal places as needed.) Because the P-value of the linear correlation coetficient is the significance level, there |sufficient evidence to support the claim that there is a linear correlation between shoe print lengths and heights of males. Based on these results, does it appear that police can use a shoe print length to estimate the height of a male? O A. Yes, because shoe print length and height do not appear to be correlated. O B. No, because shoe print length and height appear to be correlated. O. Yes, because shoe print length and height appear to be correlated. OD. No, because shoe print length and height do not appear to be correlated.

MATLAB: An Introduction with Applications
6th Edition
ISBN:9781119256830
Author:Amos Gilat
Publisher:Amos Gilat
Chapter1: Starting With Matlab
Section: Chapter Questions
Problem 1P

Related questions
Question
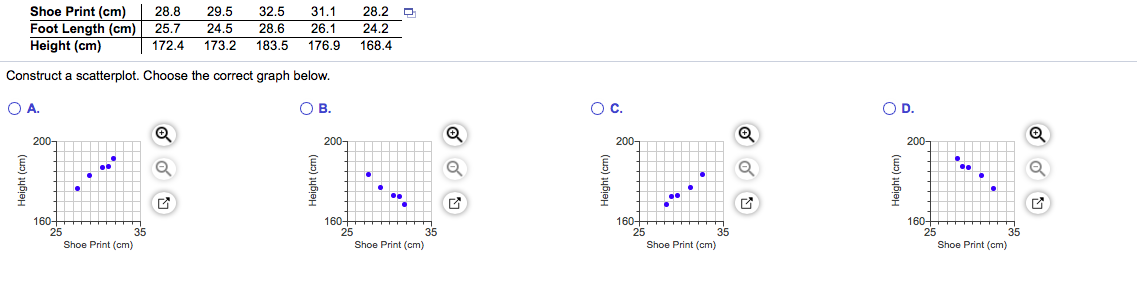
Transcribed Image Text:Shoe Print (cm)
28.8
29.5
24.5
28.2 모
24.2
168.4
32.5
31.1
Foot Length (cm)
25.7
28.6
183.5
26.1
176.9
Height (cm)
172.4
173.2
Construct a scatterplot. Choose the correct graph below.
OA.
Ов.
B.
Oc.
OD.
200-
200-
200-
200-
160-
160+
160-
160+
25
Shoe Print (cm)
35
35
35
25
Shoe Print (cm)
25
Shoe Print (cm)
25
Shoe Print (cm)
35
![The linear correlation coefficient r is ].
(Round to three decimal places as needed.)
Determine the null and alternative hypotheses.
Họ: P
H,: p
(Type integers or decimals. Do not round.)
The test statistic is O
(Round to two decimal places as needed.)
The P-value is D.
(Round to three decimal places as needed.)
Because the P-value of the linear correlation coetficient is
the significance level, there
|sufficient evidence to support the
claim that there is a linear correlation between shoe print lengths and heights of males.
Based on these results, does it appear that police can use a shoe print length to estimate the height of a male?
O A. Yes, because shoe print length and height do not appear to be correlated.
O B. No, because shoe print length and height appear to be correlated.
O. Yes, because shoe print length and height appear to be correlated.
OD. No, because shoe print length and height do not appear to be correlated.](/v2/_next/image?url=https%3A%2F%2Fcontent.bartleby.com%2Fqna-images%2Fquestion%2F3a0e442c-be85-4189-bf7e-e1405dc8eafb%2Fa0366706-9430-48cd-9e22-0a2baf73239b%2F64xsv22.png&w=3840&q=75)
Transcribed Image Text:The linear correlation coefficient r is ].
(Round to three decimal places as needed.)
Determine the null and alternative hypotheses.
Họ: P
H,: p
(Type integers or decimals. Do not round.)
The test statistic is O
(Round to two decimal places as needed.)
The P-value is D.
(Round to three decimal places as needed.)
Because the P-value of the linear correlation coetficient is
the significance level, there
|sufficient evidence to support the
claim that there is a linear correlation between shoe print lengths and heights of males.
Based on these results, does it appear that police can use a shoe print length to estimate the height of a male?
O A. Yes, because shoe print length and height do not appear to be correlated.
O B. No, because shoe print length and height appear to be correlated.
O. Yes, because shoe print length and height appear to be correlated.
OD. No, because shoe print length and height do not appear to be correlated.
Expert Solution
This question has been solved!
Explore an expertly crafted, step-by-step solution for a thorough understanding of key concepts.

This is a popular solution!

Trending now
This is a popular solution!

Step by step
Solved in 5 steps with 8 images

Recommended textbooks for you
MATLAB: An Introduction with Applications
Statistics
ISBN:
9781119256830
Author:
Amos Gilat
Publisher:
John Wiley & Sons Inc

Probability and Statistics for Engineering and th…
Statistics
ISBN:
9781305251809
Author:
Jay L. Devore
Publisher:
Cengage Learning

Statistics for The Behavioral Sciences (MindTap C…
Statistics
ISBN:
9781305504912
Author:
Frederick J Gravetter, Larry B. Wallnau
Publisher:
Cengage Learning
MATLAB: An Introduction with Applications
Statistics
ISBN:
9781119256830
Author:
Amos Gilat
Publisher:
John Wiley & Sons Inc
Probability and Statistics for Engineering and th…
Statistics
ISBN:
9781305251809
Author:
Jay L. Devore
Publisher:
Cengage Learning
Statistics for The Behavioral Sciences (MindTap C…
Statistics
ISBN:
9781305504912
Author:
Frederick J Gravetter, Larry B. Wallnau
Publisher:
Cengage Learning

Elementary Statistics: Picturing the World (7th E…
Statistics
ISBN:
9780134683416
Author:
Ron Larson, Betsy Farber
Publisher:
PEARSON

The Basic Practice of Statistics
Statistics
ISBN:
9781319042578
Author:
David S. Moore, William I. Notz, Michael A. Fligner
Publisher:
W. H. Freeman

Introduction to the Practice of Statistics
Statistics
ISBN:
9781319013387
Author:
David S. Moore, George P. McCabe, Bruce A. Craig
Publisher:
W. H. Freeman