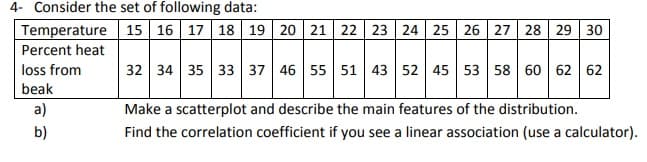
4- Consider the set of following data: Temperature 15 16 17 18 19 20 21 22 23 24 25 26 27 28 29 30 Percent heat loss from 32 34 35 33 37 46 55 51 43 52 45 53 58 60 62 62 beak a) Make a scatterplot and describe the main features of the distribution. b) Find the correlation coefficient if you see a linear association (use a calculator).
4- Consider the set of following data: Temperature 15 16 17 18 19 20 21 22 23 24 25 26 27 28 29 30 Percent heat loss from 32 34 35 33 37 46 55 51 43 52 45 53 58 60 62 62 beak a) Make a scatterplot and describe the main features of the distribution. b) Find the correlation coefficient if you see a linear association (use a calculator).

Glencoe Algebra 1, Student Edition, 9780079039897, 0079039898, 2018
18th Edition
ISBN:9780079039897
Author:Carter
Publisher:Carter
Chapter4: Equations Of Linear Functions
Section4.5: Correlation And Causation
Problem 24PFA

Related questions
Question
Transcribed Image Text:4- Consider the set of following data:
Temperature 15 16 17 18 19 20 21 22 23 24 25 26 27 28 29 30
Percent heat
loss from
32 34 35 33 37 46 55 51 43 52 45 53 58 60 62 62
beak
a)
Make a scatterplot and describe the main features of the distribution.
b)
Find the correlation coefficient if you see a linear association (use a calculator).
Expert Solution
This question has been solved!
Explore an expertly crafted, step-by-step solution for a thorough understanding of key concepts.

Step by step
Solved in 3 steps with 3 images

Recommended textbooks for you
Glencoe Algebra 1, Student Edition, 9780079039897…
Algebra
ISBN:
9780079039897
Author:
Carter
Publisher:
McGraw Hill
Glencoe Algebra 1, Student Edition, 9780079039897…
Algebra
ISBN:
9780079039897
Author:
Carter
Publisher:
McGraw Hill