Heights of adult males are known to have a normal distribution. A researcher claims to have randomly selected adult males and measured their heights with the resulting relative frequency distribution as shown here. Identify two major flaws with these results. Relative Height (cm) Frequency 24% 25% 22% 26% 28% 130-144 145-159 160-174 175-189 190-204 Select all that apply. O A. The classes do not allow for the possibility that an adult male could be between 144 cm and 145 cm tall, or between 159 cm and 160 cm tall, and so on. O B. The relative frequencies were recorded as percents instead of counts. O C. The classes do not allow for the possibility that an adult male could be less than 130 cm tall or greater than 204 cm tall. O D. All of the relative frequencies are different. If they are from a normal distribution, they should all be exactly the same. O E. The sum of the relative frequencies is 125%, but it should be 100%, with a small possible round-off error. OF. All of the relative frequencies appear to be roughly the same. If they are from a normal distribution, they should start low, reach a maximum, and then decrease.
Heights of adult males are known to have a normal distribution. A researcher claims to have randomly selected adult males and measured their heights with the resulting relative frequency distribution as shown here. Identify two major flaws with these results. Relative Height (cm) Frequency 24% 25% 22% 26% 28% 130-144 145-159 160-174 175-189 190-204 Select all that apply. O A. The classes do not allow for the possibility that an adult male could be between 144 cm and 145 cm tall, or between 159 cm and 160 cm tall, and so on. O B. The relative frequencies were recorded as percents instead of counts. O C. The classes do not allow for the possibility that an adult male could be less than 130 cm tall or greater than 204 cm tall. O D. All of the relative frequencies are different. If they are from a normal distribution, they should all be exactly the same. O E. The sum of the relative frequencies is 125%, but it should be 100%, with a small possible round-off error. OF. All of the relative frequencies appear to be roughly the same. If they are from a normal distribution, they should start low, reach a maximum, and then decrease.

MATLAB: An Introduction with Applications
6th Edition
ISBN:9781119256830
Author:Amos Gilat
Publisher:Amos Gilat
Chapter1: Starting With Matlab
Section: Chapter Questions
Problem 1P

Related questions
Topic Video
Question
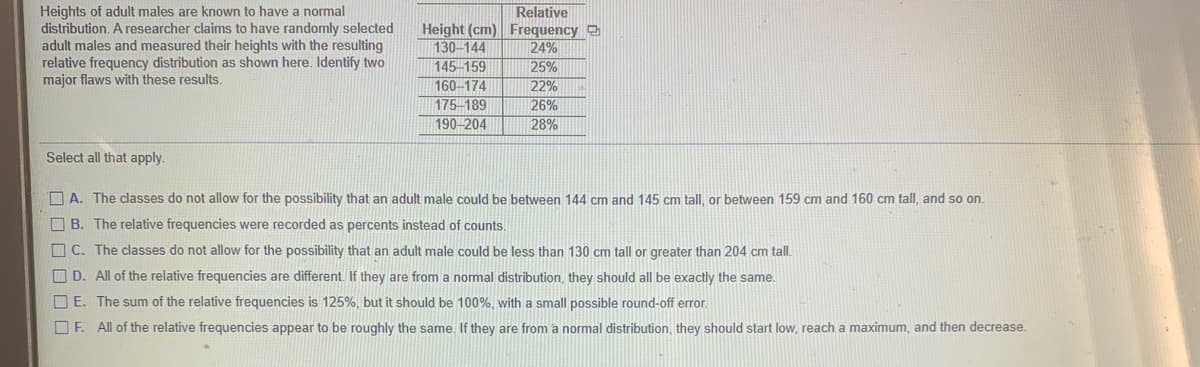
Transcribed Image Text:Relative
Heights of adult males are known to have a normal
distribution. A researcher claims to have randomly selected
adult males and measured their heights with the resulting
relative frequency distribution as shown here. Identify two
major flaws with these results.
Height (cm) Frequency
130-144
145 159
160-174
175-189
190-204
24%
25%
22%
26%
28%
Select all that apply.
O A. The classes do not allow for the possibility that an adult male could be between 144 cm and 145 cm tall, or between 159 cm and 160 cm tall, and so on
B. The relative frequencies were recorded as percents instead of counts.
O C. The classes do not allow for the possibility that an adult male could be less than 130 cm tall or greater than 204 cm tall.
O D. All of the relative frequencies are different. If they are from a normal distribution, they should all be exactly the same.
O E. The sum of the relative frequencies is 125%, but it should be 100%, with a small possible round-off error.
O F. All of the relative frequencies appear to be roughly the same. If they are from a normal distribution, they should start low, reach a maximum, and then decrease.
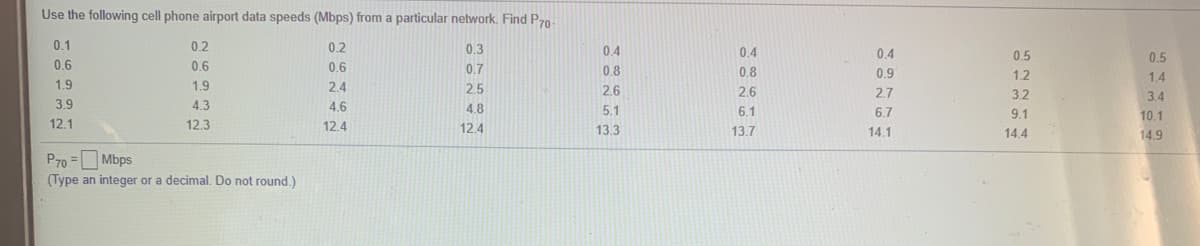
Transcribed Image Text:Use the following cell phone airport data speeds (Mbps) from a particular network. Find Pz0
0.1
0.2
0.2
0.3
0.4
4
0.4
0.4
0.5
0.5
0.6
0.6
0.6
0.7
0.8
0.8
09
1.2
1.4
1.9
1.9
2.4
2.5
2.6
2.6
2.7
3.2
3.4
3.9
4.3
4.6
4.8
5.1
6.1
6.7
9.1
10.1
12.1
12.3
12.4
12.4
13.3
13.7
14.1
14.4
14.9
P70 =O Mbps
(Type an integer or a decimal. Do not round.)
%3D
Expert Solution
This question has been solved!
Explore an expertly crafted, step-by-step solution for a thorough understanding of key concepts.

This is a popular solution!

Trending now
This is a popular solution!

Step by step
Solved in 2 steps

Knowledge Booster


Learn more about
Need a deep-dive on the concept behind this application? Look no further. Learn more about this topic, statistics and related others by exploring similar questions and additional content below.Recommended textbooks for you
MATLAB: An Introduction with Applications
Statistics
ISBN:
9781119256830
Author:
Amos Gilat
Publisher:
John Wiley & Sons Inc

Probability and Statistics for Engineering and th…
Statistics
ISBN:
9781305251809
Author:
Jay L. Devore
Publisher:
Cengage Learning

Statistics for The Behavioral Sciences (MindTap C…
Statistics
ISBN:
9781305504912
Author:
Frederick J Gravetter, Larry B. Wallnau
Publisher:
Cengage Learning
MATLAB: An Introduction with Applications
Statistics
ISBN:
9781119256830
Author:
Amos Gilat
Publisher:
John Wiley & Sons Inc
Probability and Statistics for Engineering and th…
Statistics
ISBN:
9781305251809
Author:
Jay L. Devore
Publisher:
Cengage Learning
Statistics for The Behavioral Sciences (MindTap C…
Statistics
ISBN:
9781305504912
Author:
Frederick J Gravetter, Larry B. Wallnau
Publisher:
Cengage Learning

Elementary Statistics: Picturing the World (7th E…
Statistics
ISBN:
9780134683416
Author:
Ron Larson, Betsy Farber
Publisher:
PEARSON

The Basic Practice of Statistics
Statistics
ISBN:
9781319042578
Author:
David S. Moore, William I. Notz, Michael A. Fligner
Publisher:
W. H. Freeman

Introduction to the Practice of Statistics
Statistics
ISBN:
9781319013387
Author:
David S. Moore, George P. McCabe, Bruce A. Craig
Publisher:
W. H. Freeman