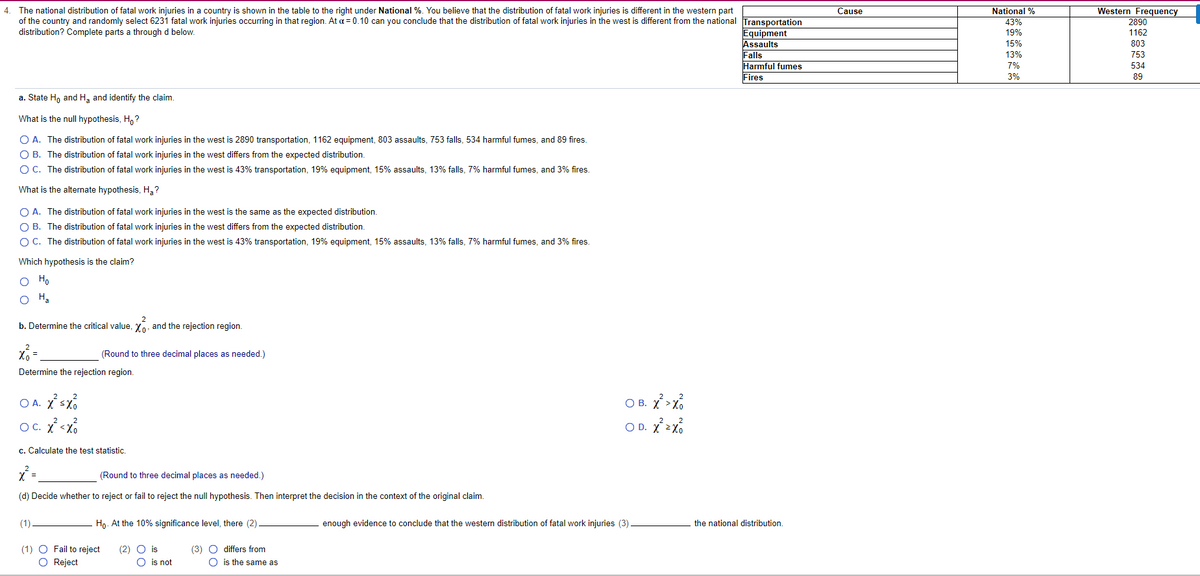
4. The national distribution of fatal work injuries in a country is shown in the table to the right under National %. You believe that the distribution of fatal work injuries is different in the western part of the country and randomly select 6231 fatal work injuries occurring in that region. At a= 0.10 can you conclude that the distribution of fatal work injuries in the west is different from the national Transportation distribution? Complete parts a through d below. Cause National % Western Frequency 2890 1162 43% Equipment Assaults 19% 15% 803 13% 753 Falls Harmful fumes 7% 534 Fires 3% 89 a. State H, and H, and identify the claim. What is the null hypothesis, H,? O A. The distribution of fatal work injuries in the west is 2890 transportation, 1162 equipment, 803 assaults, 753 falls, 534 harmful fumes, and 89 fires. O B. The distribution of fatal work injuries in the west differs from the expected distribution. OC. The distribution of fatal work injuries in the west is 43% transportation, 19% equipment, 15% assaults, 13% falls, 7% harmful fumes, and 3% fires. What is the alternate hypothesis, H,? O A. The distribution of fatal work injuries in the west is the same as the expected distribution. O B. The distribution of fatal work injuries in the west differs from the expected distribution. OC. The distribution of fatal work injuries in the west is 43% transportation, 19% equipment, 15% assaults, 13% falls, 7% harmful fumes, and 3% fires. Which hypothesis is the claim? O Ho O H. b. Determine the critical value, YA, and the rejection region. (Round to three decimal places as needed.) Determine the rejection region. OA. Xsx O B. X > x% c. Calculate the test statistic. (Round to three decimal places as needed.) (d) Decide whether to reject or fail to reject the null hypothesis. Then interpret the decision in the context of the original claim. (1) Họ. At the 10% significance level, there (2) enough evidence to conclude that the westen distribution of fatal work injuries (3) the national distribution. (3) O differs from (1) O Fail to reject O Reject (2) O is O is not O is the same as


Inverse Normal Distribution
The method used for finding the corresponding z-critical value in a normal distribution using the known probability is said to be an inverse normal distribution. The inverse normal distribution is a continuous probability distribution with a family of two parameters.
Mean, Median, Mode
It is a descriptive summary of a data set. It can be defined by using some of the measures. The central tendencies do not provide information regarding individual data from the dataset. However, they give a summary of the data set. The central tendency or measure of central tendency is a central or typical value for a probability distribution.
Z-Scores
A z-score is a unit of measurement used in statistics to describe the position of a raw score in terms of its distance from the mean, measured with reference to standard deviation from the mean. Z-scores are useful in statistics because they allow comparison between two scores that belong to different normal distributions.


Trending now
This is a popular solution!

Step by step
Solved in 5 steps


