Heludes relative frequencies based on the frequency distributions shown below, then compare the amounts of tar in nonfiltered and filt es. Do the cigarette filters appear to be effective? (Hint: The filters reduce the amount of tar ingested by the smoker.) ck the icon to view the frequency distributions. te the relative frequency table below. Relative Relative Frequency (Filtered) 3% Frequency Distributions Frequency g) (Nonfiltered) 0% |이% 1% 2% 16 % 24 % 5% 10 % 25 % 25 % 25 % Tar (mg) in Nonfiltered Tar (mg) in Filtered Cigarettes Frequency 2-5 13 Cigarettes Frequency 10- 13 17 21 3 14 - 17 6-9 25 18- 21 10 17
Heludes relative frequencies based on the frequency distributions shown below, then compare the amounts of tar in nonfiltered and filt es. Do the cigarette filters appear to be effective? (Hint: The filters reduce the amount of tar ingested by the smoker.) ck the icon to view the frequency distributions. te the relative frequency table below. Relative Relative Frequency (Filtered) 3% Frequency Distributions Frequency g) (Nonfiltered) 0% |이% 1% 2% 16 % 24 % 5% 10 % 25 % 25 % 25 % Tar (mg) in Nonfiltered Tar (mg) in Filtered Cigarettes Frequency 2-5 13 Cigarettes Frequency 10- 13 17 21 3 14 - 17 6-9 25 18- 21 10 17

Glencoe Algebra 1, Student Edition, 9780079039897, 0079039898, 2018
18th Edition
ISBN:9780079039897
Author:Carter
Publisher:Carter
Chapter10: Statistics
Section10.6: Summarizing Categorical Data
Problem 38HP

Related questions
Question
100%
My answers were incorrect ?
Transcribed Image Text:tlón Help
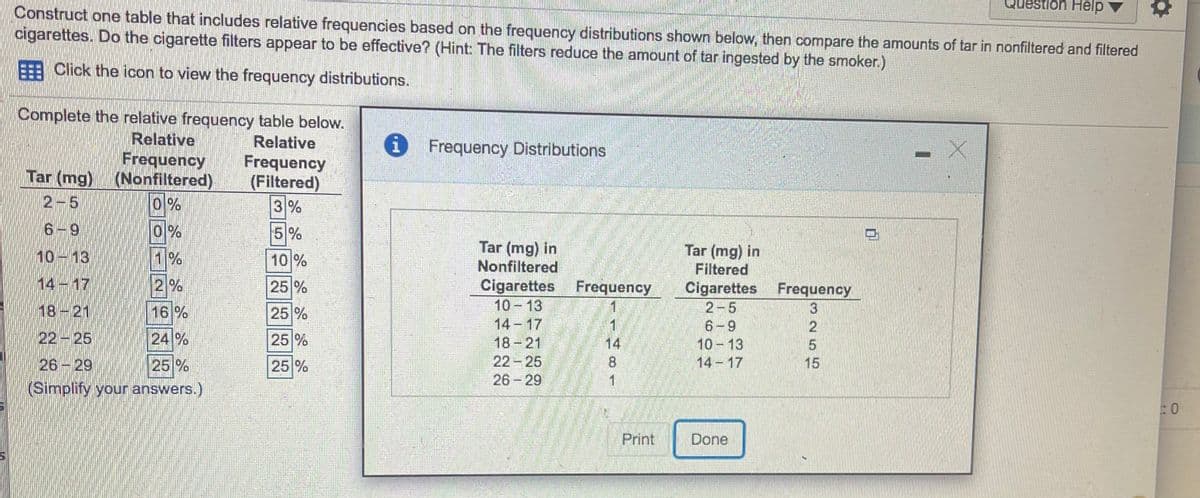
Construct one table that includes relative frequencies based on the frequency distributions shown below, then compare the amounts of tar in nonfiltered and filtered
cigarettes. Do the cigarette filters appear to be effective? (Hint: The filters reduce the amount of tar ingested by the smoker.)
EE Click the icon to view the frequency distributions.
Complete the relative frequency table below.
Relative
Frequency
Tar (mg) (Nonfiltered)
Relative
i
Frequency Distributions
Frequency
(Filtered)
3%
2-5
0%
6-9
이%
5%
Tar (mg) in
Nonfiltered
Cigarettes Frequency
10 13
14 17
18-21
22 25
26 29
Tar (mg) in
Filtered
10-13
1%
10 %
14-17
2%
25 %
Cigarettes Frequency
2-5
6-9
10 13
14-17
18-21
16 %
25 %
22-25
24 %
25 %
14
26-29
25 %
25 %
8
15
(Simplify your answers.)
:0
Print
Done
Expert Solution
This question has been solved!
Explore an expertly crafted, step-by-step solution for a thorough understanding of key concepts.

This is a popular solution!

Trending now
This is a popular solution!

Step by step
Solved in 3 steps with 2 images

Knowledge Booster


Learn more about
Need a deep-dive on the concept behind this application? Look no further. Learn more about this topic, statistics and related others by exploring similar questions and additional content below.Recommended textbooks for you
Glencoe Algebra 1, Student Edition, 9780079039897…
Algebra
ISBN:
9780079039897
Author:
Carter
Publisher:
McGraw Hill

Big Ideas Math A Bridge To Success Algebra 1: Stu…
Algebra
ISBN:
9781680331141
Author:
HOUGHTON MIFFLIN HARCOURT
Publisher:
Houghton Mifflin Harcourt

Algebra: Structure And Method, Book 1
Algebra
ISBN:
9780395977224
Author:
Richard G. Brown, Mary P. Dolciani, Robert H. Sorgenfrey, William L. Cole
Publisher:
McDougal Littell
Glencoe Algebra 1, Student Edition, 9780079039897…
Algebra
ISBN:
9780079039897
Author:
Carter
Publisher:
McGraw Hill
Big Ideas Math A Bridge To Success Algebra 1: Stu…
Algebra
ISBN:
9781680331141
Author:
HOUGHTON MIFFLIN HARCOURT
Publisher:
Houghton Mifflin Harcourt
Algebra: Structure And Method, Book 1
Algebra
ISBN:
9780395977224
Author:
Richard G. Brown, Mary P. Dolciani, Robert H. Sorgenfrey, William L. Cole
Publisher:
McDougal Littell

Holt Mcdougal Larson Pre-algebra: Student Edition…
Algebra
ISBN:
9780547587776
Author:
HOLT MCDOUGAL
Publisher:
HOLT MCDOUGAL