Here is another set of regression results, for a generic DV called y and a generic N called x SUMMARY OUTPUT Regression Stotistics Multiple R RSquare 0.00971347 Adjusted R Square Standard Fmor Observations 20.5R97879 74 ANOVA MS 299 3386 259 3986 0.70623 Significonce Regression 0.40348 Residual 72 30523.63 423.9394 Total 73 20823.03 Srandard Upper OSK Coricienty Errur I Sta Puale lower 95% Intercept 44.3618365 5.205352 8.522351 1.62E-12 33.58515 54.73852 01587303 018888 0.84037 0.40348 0.217796 7) How many obsenvations were in this dataset? 8) Fallow the four staps in Ch 14: Handout 22 to perform the hypothesis test to ansoer the foloeing question: la there a statiatically significant relationahip between y and x? Use ana- ans significance level. Ihe guidelines from the test in Question 1 apply here to. 9 Given your result in Question 3, is it appropriete to continue interpretine this model?
Here is another set of regression results, for a generic DV called y and a generic N called x SUMMARY OUTPUT Regression Stotistics Multiple R RSquare 0.00971347 Adjusted R Square Standard Fmor Observations 20.5R97879 74 ANOVA MS 299 3386 259 3986 0.70623 Significonce Regression 0.40348 Residual 72 30523.63 423.9394 Total 73 20823.03 Srandard Upper OSK Coricienty Errur I Sta Puale lower 95% Intercept 44.3618365 5.205352 8.522351 1.62E-12 33.58515 54.73852 01587303 018888 0.84037 0.40348 0.217796 7) How many obsenvations were in this dataset? 8) Fallow the four staps in Ch 14: Handout 22 to perform the hypothesis test to ansoer the foloeing question: la there a statiatically significant relationahip between y and x? Use ana- ans significance level. Ihe guidelines from the test in Question 1 apply here to. 9 Given your result in Question 3, is it appropriete to continue interpretine this model?

College Algebra
7th Edition
ISBN:9781305115545
Author:James Stewart, Lothar Redlin, Saleem Watson
Publisher:James Stewart, Lothar Redlin, Saleem Watson
Chapter1: Equations And Graphs
Section: Chapter Questions
Problem 10T: Olympic Pole Vault The graph in Figure 7 indicates that in recent years the winning Olympic men’s...

Related questions
Topic Video
Question
Thank you.
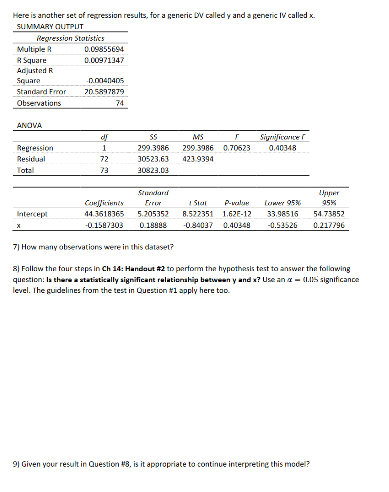
Transcribed Image Text:Here is another set of regression results, for a generic DV called y and a generic IV called x.
SUMMARY OUTPUT
Regression Statistics
Multiple R
R Square
0.09855694
0.00971347
Adjusted R
Square
-D.004n405
Standard Fror
20.5897879
Observations
74
ANOVA
SS
MS
Signifivoce
Regression
299.3986
299 3986 0.70623
0.40348
Residual
72
30523.63
423.9394
Total
73
20823.03
Sturndard
Coeficienis
1 Stai
P-walue
lower 95N
95%
Intercept
44.3618365
5.205352
8.522351 1.62E-12
33.98515
54.73852
-0.1587303
0.18988
-0.84037
0.40349
-0.53526
0.217796
7) How many observations were in this dataset?
8) Fallaw the foaur steps in Ch 14: Handout #2 to perform the hypothesis test to answer the following
question: la there a statistically significant relationahip between y and x? Use an a - (1.5 significance
level. Ihe guidelines from the test in Question #1 apply here tao.
9) Given your result in Question 48, is it appropriate to continue interpreting this model?
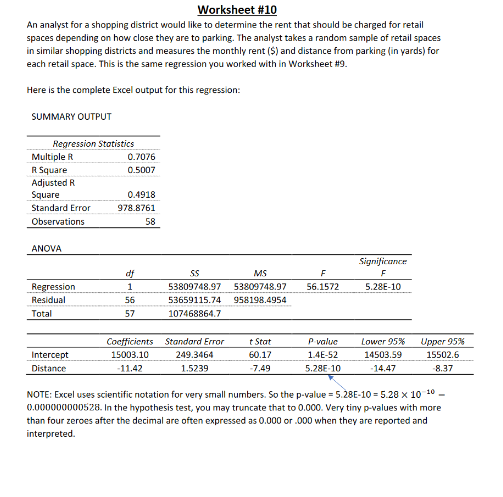
Transcribed Image Text:Worksheet #10
An analyst for a shopping district would like to determine the rent that should be charged for retail
spaces depending on how close they are to parking. The analyst takes a random sample of retail spaces
in similar shopping districts and measures the monthly rent ($) and distance from parking (in yards) for
each retail space. This is the same regression you worked with in Worksheet #9.
Here is the complete Excel output for this regression:
SUMMARY OUTPUT
Regression Stotistics
Multiple R
R Square
0.7076
0.5007
Adjusted R
Square
Standard Error
0.4918
978.8761
Observations
58
ANOVA
Significaner
df
SS
MS
Regression
1
53809748.97
53809748.97
56.1572
5.28E-10
Residual
56
53659115.74
958198.4954
Total
57
107468864.7
Coefficients
t Stat
P value
Upper 95%
Standard Error
Lower 95%
Intercept
15003.10
249.3464
60.17
1.4E-52
14503.59
15502.6
Distance
-11.42
1.5239
-7,49
5.28E-10
-14.47
8.37
NOTE: Excel uses scientific notation for very small numbers. So the p-value = 5.28E-10 = 5.28 x 10 10 -
0.000000000528. In the hypothesis test, you may truncate that to 0.000. Very tiny p-values with more
than four zeroes after the decimal are often expressed as 0.000 or .000 when they are reported and
interpreted.
Expert Solution
This question has been solved!
Explore an expertly crafted, step-by-step solution for a thorough understanding of key concepts.

Step by step
Solved in 4 steps

Knowledge Booster


Learn more about
Need a deep-dive on the concept behind this application? Look no further. Learn more about this topic, statistics and related others by exploring similar questions and additional content below.Recommended textbooks for you
College Algebra
Algebra
ISBN:
9781305115545
Author:
James Stewart, Lothar Redlin, Saleem Watson
Publisher:
Cengage Learning

Linear Algebra: A Modern Introduction
Algebra
ISBN:
9781285463247
Author:
David Poole
Publisher:
Cengage Learning

Glencoe Algebra 1, Student Edition, 9780079039897…
Algebra
ISBN:
9780079039897
Author:
Carter
Publisher:
McGraw Hill
College Algebra
Algebra
ISBN:
9781305115545
Author:
James Stewart, Lothar Redlin, Saleem Watson
Publisher:
Cengage Learning
Linear Algebra: A Modern Introduction
Algebra
ISBN:
9781285463247
Author:
David Poole
Publisher:
Cengage Learning
Glencoe Algebra 1, Student Edition, 9780079039897…
Algebra
ISBN:
9780079039897
Author:
Carter
Publisher:
McGraw Hill