Historical Resolts Forecast Period Balance Sheet 2016 2017 2018 2019 2020 2021 2022 2023 2024 2025 Assets Current assets: Cash Accounts Receivable Inventories Recoverable taxes Other current financial assets Other current asets 10.476 15.005 10.744 4,373 1,511 3.344 45,453 10.767 17,576 11,364 5,172 737 2.041 55,657 23,727 14,047 10,051 6,038 005 2.022 57,490 20,401 15.476 10,530 7.567 1,076 1,648 56,796 43.497 11,523 9,727 5,471 478 1.744 72,440 49,493 14.009 10.554 5.724 921 2.10 83.662 53.909 15,071 10,575 5,994 003 1.923 88,276 63,593 15,160 10,644 6,159 017 1,099 90,272 71.019 15,020 10,571 6,183 019 1,075 105,400 01.231 15,056 10.587 5.906 760 1,920 115,469 Total current assets Non-current assets: 9,751 1,302 61,107 112,050 10,432 204 6.037 201.043 12.550 1,182 55,001 97.941 8.001 2,207 7312 185.002 10,140 935 43,530 81,060 9.075 1,720 6.006 154.163 10.227 Investments in assoc and joint Right-of use assets PPE Intangible assets, net Deferred tax assets Other non-current financial assets Other non-current assets Total non-currentassets TOTAL ASSETS 7.623 1,270 59,460 103,971 11,143 2.099 4,452 190.626 $279,256 $285,677$263,787 $257,839 $263,066 $260,664 $260,648 $261,035 $259,650 $261,830 22.357 12,540 10,518 65.200 123.964 5.901 4,733 11.480 233.803 75,827 124,243 0,012 1,277 .121 230.020 61,942 116,004 8,438 2,123 6.472 200.297 10,598 1,093 50,075 92.260 9,365 1,702 6,479 172.373 10,210 1,011 47,060 06.000 9,636 1,707 6,150 162.763 40.266 77.120 9.764 2,023 6.096 146.360 Liabilities and Equity Current liabiities Bank loans and notes payable Current portion of non-current debt Current portion of lease liabilities Interest payable 1,645 3,372 560 712 1,573 1,479 2,057 10,114 1,302 10,222 002 10,603 403 439 1,500 7,150 522 531 1,495 8,294 522 533 19,275 8,835 7,223 2.029 40,205 1,302 7,930 522 542 1,302 7,471 522 552 1.482 6.845 529 574 520 407 497 Suppliers Accounts payable Тахев рауable Oher current financial liabilibes Total current labilities 21,489 6,355 7,560 892 30,860 19.956 11,397 7,074 4,509 55.594 19,746 5,904 7,207 566 45,524 19,032 10,331 7,156 1.204 51,010 17,195 10.013 7,400 1.940 42,845 19,644 0,017 7,279 1,840 47,290 19,138 8,002 7,253 1.533 47,193 19,017 8,032 7,262 1.727 46,764 10.054 0.045 7,284 1816 46,229 Non-current liabilities: 71,198 3,195 425 2,830 1,590 9,154 10.392 135,586 Bank loans and notes payable Employee benefits Non-current portion of lease liab 85,057 2,319 71,109 3,029 70,201 2,652 Deferred tax liabines Other non-current liabilies Provisions Total non-current liabilites Total abilties 1,205 5,745 15.029 110,155 150,023 1,714 1,169 12,272 89.373 144,967 2,856 1,376 9428 16.613 132,037 58,492 3.293 900 3,771 1,897 8.791 77.144 128,154 82,461 3.030 746 2,474 934 7.311 97.764 140.609 73,640 3,026 618 2,404 2,224 10,500 92,479 139,777 71,197 3,168 513 2.644 1,520 9.674 0.714 136,919 71,398 3,304 352 2.825 1,633 9.099 18.611 73,079 3,306 292 2.635 1,500 9.161 90.953 137,182 135,375 Equity: Capital stock Adational paid-in capital Retained earnings Other equity instruments Cumulative other compre Loss Equity att. To equity holders NCI interest in subsidiaries Total equity TOTAL LIABILITIES AND EQUITY 2,060 45,560 75,917 1,740. 4.923 116.874 5.583 122.457 $279,256 $285,677 $263,787 $257,839 $263,066 $268,664 $260,648 $261,035 $259,650 $261,830 2.060 45,560 75,020 1,740 1.234 - 122.934 6.751 129.685 2,048 41,490 01,579 2,060 45,560 61,706 485 13.648 122,569 18,141 140,710 2,060 2,060 45,560 80,836 1,195 7.251. 120,011 8,875 120.000 2,060 45,560 86,075 1,337. 17.860. 114,408 9.231 123729 2,060 45,560 91,652 1,507- 19.765 118,000 7.449 125,449 2,060 485. 2.495 122,137 7,096 120,233 45.560 71270 1,524 7,578 124,944 6.006 131750 45,560 97,501 1,504. 27.010 116,697 7.570 124.275 2,060 45.560 103,015 1,456 33.174 116.904 7.743 124.648 Check 0.000 0.000 0.000 0.000 0.000 0 000 0.000 0.000 0.000 0.000
Historical Resolts Forecast Period Balance Sheet 2016 2017 2018 2019 2020 2021 2022 2023 2024 2025 Assets Current assets: Cash Accounts Receivable Inventories Recoverable taxes Other current financial assets Other current asets 10.476 15.005 10.744 4,373 1,511 3.344 45,453 10.767 17,576 11,364 5,172 737 2.041 55,657 23,727 14,047 10,051 6,038 005 2.022 57,490 20,401 15.476 10,530 7.567 1,076 1,648 56,796 43.497 11,523 9,727 5,471 478 1.744 72,440 49,493 14.009 10.554 5.724 921 2.10 83.662 53.909 15,071 10,575 5,994 003 1.923 88,276 63,593 15,160 10,644 6,159 017 1,099 90,272 71.019 15,020 10,571 6,183 019 1,075 105,400 01.231 15,056 10.587 5.906 760 1,920 115,469 Total current assets Non-current assets: 9,751 1,302 61,107 112,050 10,432 204 6.037 201.043 12.550 1,182 55,001 97.941 8.001 2,207 7312 185.002 10,140 935 43,530 81,060 9.075 1,720 6.006 154.163 10.227 Investments in assoc and joint Right-of use assets PPE Intangible assets, net Deferred tax assets Other non-current financial assets Other non-current assets Total non-currentassets TOTAL ASSETS 7.623 1,270 59,460 103,971 11,143 2.099 4,452 190.626 $279,256 $285,677$263,787 $257,839 $263,066 $260,664 $260,648 $261,035 $259,650 $261,830 22.357 12,540 10,518 65.200 123.964 5.901 4,733 11.480 233.803 75,827 124,243 0,012 1,277 .121 230.020 61,942 116,004 8,438 2,123 6.472 200.297 10,598 1,093 50,075 92.260 9,365 1,702 6,479 172.373 10,210 1,011 47,060 06.000 9,636 1,707 6,150 162.763 40.266 77.120 9.764 2,023 6.096 146.360 Liabilities and Equity Current liabiities Bank loans and notes payable Current portion of non-current debt Current portion of lease liabilities Interest payable 1,645 3,372 560 712 1,573 1,479 2,057 10,114 1,302 10,222 002 10,603 403 439 1,500 7,150 522 531 1,495 8,294 522 533 19,275 8,835 7,223 2.029 40,205 1,302 7,930 522 542 1,302 7,471 522 552 1.482 6.845 529 574 520 407 497 Suppliers Accounts payable Тахев рауable Oher current financial liabilibes Total current labilities 21,489 6,355 7,560 892 30,860 19.956 11,397 7,074 4,509 55.594 19,746 5,904 7,207 566 45,524 19,032 10,331 7,156 1.204 51,010 17,195 10.013 7,400 1.940 42,845 19,644 0,017 7,279 1,840 47,290 19,138 8,002 7,253 1.533 47,193 19,017 8,032 7,262 1.727 46,764 10.054 0.045 7,284 1816 46,229 Non-current liabilities: 71,198 3,195 425 2,830 1,590 9,154 10.392 135,586 Bank loans and notes payable Employee benefits Non-current portion of lease liab 85,057 2,319 71,109 3,029 70,201 2,652 Deferred tax liabines Other non-current liabilies Provisions Total non-current liabilites Total abilties 1,205 5,745 15.029 110,155 150,023 1,714 1,169 12,272 89.373 144,967 2,856 1,376 9428 16.613 132,037 58,492 3.293 900 3,771 1,897 8.791 77.144 128,154 82,461 3.030 746 2,474 934 7.311 97.764 140.609 73,640 3,026 618 2,404 2,224 10,500 92,479 139,777 71,197 3,168 513 2.644 1,520 9.674 0.714 136,919 71,398 3,304 352 2.825 1,633 9.099 18.611 73,079 3,306 292 2.635 1,500 9.161 90.953 137,182 135,375 Equity: Capital stock Adational paid-in capital Retained earnings Other equity instruments Cumulative other compre Loss Equity att. To equity holders NCI interest in subsidiaries Total equity TOTAL LIABILITIES AND EQUITY 2,060 45,560 75,917 1,740. 4.923 116.874 5.583 122.457 $279,256 $285,677 $263,787 $257,839 $263,066 $268,664 $260,648 $261,035 $259,650 $261,830 2.060 45,560 75,020 1,740 1.234 - 122.934 6.751 129.685 2,048 41,490 01,579 2,060 45,560 61,706 485 13.648 122,569 18,141 140,710 2,060 2,060 45,560 80,836 1,195 7.251. 120,011 8,875 120.000 2,060 45,560 86,075 1,337. 17.860. 114,408 9.231 123729 2,060 45,560 91,652 1,507- 19.765 118,000 7.449 125,449 2,060 485. 2.495 122,137 7,096 120,233 45.560 71270 1,524 7,578 124,944 6.006 131750 45,560 97,501 1,504. 27.010 116,697 7.570 124.275 2,060 45.560 103,015 1,456 33.174 116.904 7.743 124.648 Check 0.000 0.000 0.000 0.000 0.000 0 000 0.000 0.000 0.000 0.000

Essentials Of Investments
11th Edition
ISBN:9781260013924
Author:Bodie, Zvi, Kane, Alex, MARCUS, Alan J.
Publisher:Bodie, Zvi, Kane, Alex, MARCUS, Alan J.
Chapter1: Investments: Background And Issues
Section: Chapter Questions
Problem 1PS

Related questions
Question
how you explain the image below by their year
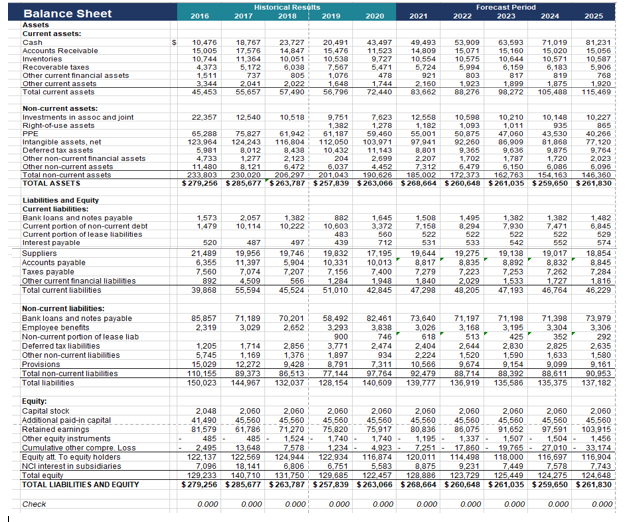
Transcribed Image Text:Historical Reselts
2018
Forecast Period
2023
Balance Sheet
Assets
2016
2017
2019
2020
2021
2022
2024
2025
Current assets:
23,727
14,847
10,051
6,038
805
2,022
57,490
20,491
15,476
10,538
7,567
1,076
1,648
56,796
Cash
10.476
18,767
17,576
11.364
5,172
737
2.041
55,657
43,497
11,523
9,727
5,471
478
1.744
72,440
49,493
53,909
15,071
10,575
5,994
63,593
15,160
10,644
6,159
71,019
15,020
10,571
6,183
81.231
15,005
10,744
4.373
15,056
10.587
5,906
768
1,920
115,469
Accounts Receivable
14,809
Inventories
Recoverable taxes
Other current financial assets
Other current assets
Total current assets
10,554
5,724
1,511
921
803
817
819
3.344
45.453
2.160
83,662
1,923
88,276
1,899
98,272
1,875
105,488
Non-current assets:
10,590
1,093
50,875
92,260
9,365
1,702
6,479
172.373
10.227
Investments in assoc and joint
Right-of-use assets
PPE
Intangible assets, net
Deferred tax assets
7,623
1,278
59.460
103.971
11,143
2,699
4.452
190.626
$279,256 $285,677 $263,787 $257,839 $263,066 $268,664 $260,648 $261,035 $259,650 $261,830
22,357
12,540
10,518
9,751
1,382
61,187
112.050
10,432
12,550
10.210
1,011
47,060
86.909
9,636
1,787
6,150
162.763
10,148
1,182
935
865
55.001
97,941
8,801
43,530
81,868
9,875
1,720
6,086
154,163
40.266
77.120
9,764
2,023
6,096
146 360
65.288
123.964
5,981
75,827
124,243
8,012
1,277
8,121
230.020
61,942
116.804
8,438
2,123
6.472
206,297
Other non-current financial assets
4,733
204
2,207
Other non-curent assets
Total non-current assets
TOTAL ASSETS
11.480
233.803
6,037
201.043
7,312
185.002
Liabilities and Equity
Current liabilities:
Bank loans and notes payable
Current portion of non-current debt
1,573
1,479
2,057
10,114
1,382
10,222
882
10,603
1,645
3,372
560
1,508
7,158
522
1,495
0,294
522
1,382
7,930
522
1,382
7,471
522
1,482
6,045
529
574
18,854
8.845
483
439
Current portion of lease liabilities
Interest payable
Suppliers
Accounts payable
Taxes payable
Other current financial liabilities
520
487
497
712
531
533
542
552
19,956
11,397
7,074
4,509
55,594
19,746
5,904
21,489
6,355
7,560
892
39,868
19,138
8,892
7,253
1.533
47,193
19,832
10,331
17,195
10,013
7.400
1,948
42,845
19,644
8,817
7,279
1,840
47,298
19,275
8,835
7.223
2,029
48,205
19,017
8832
7,262
1,727
46,764
7,207
566
45,524
7,156
1.284
51,010
7,284
1.816
46,229
Total current liabilities
Non-current liabilities:
73,979
3.306
Bank loans and notes payable
Employee benefits
Non-current portion of lease liab
Deferred tax liabilities
Other non-current liabilities
Provisions
Total non-current liabilities
Total liabilities
85,857
2,319
71,189
3,029
70,201
2,652
58,492
3,293
82,461
3,838
1,205
5,745
15,029
110,155
150,023
1,714
1,169
12,272
89,373
144,967
900
3,771
1,897
8,791
77,144
128,154
746
2,474
934
7,311
97,764
140.609
73,640
3,026
618
2,404
2,224
10,566
92,479
71,197
3,168
513
2,644
1,520
9,674
88,714
136,919
71,198
3,195
425
2,830
1,590
9,154
88,392
135.586
71,398
3,304
352
2,825
1,633
9,099
88,611
135,375
292
2,635
1,580
9.161
90.953
137,182
2,856
1,376
9,428
86,513
132,037
139,777
Equity:
2.060
45,560
75,917
1,740
4,923-
116.874
5,583
122.457
$279,256 $285,677 $263,787 $257,839 $263,066 $268,664 $260,648 $261,035 $259,650 $261,830
2,048
41,490
81,579
485-
Capital stock
Additional paid-in capital
Retained earnings
Other equity instruments
Cumulative other compre. Loss
Equity att. To equity holders
2,060
45,560
61,786
485
13,648
122,569
18,141
140,710
2,060
45,560
71,270
1,524
7,578
124,944
6,806
131,750
2,060
45,560
75,820
1,740
1.234
122,934
6,751
129.685
2,060
45,560
80,836
1,195-
7.251-
120.011
2,060
45,560
86,075
1,337.
17,860-
114,498
9,231
123,729
2,060
45,560
91,652
1,507-
19,765-
118,000
7,449
125,449
2,060
45,560
97,591
1,504-
27.010-
116.697
7,578
124.275
2,060
45,560
103,915
1.456
2.495
122,137
7,096
129.233
33.174
116,904
7,743
124,648
NCI interest in subsidiaries
8,875
128,886
Total equity
TOTAL LIABILITIES AND EQUITY
Check
0.000
0.000
0.000
0.000
0.000
0 000
0.000
0.000
0.000
0.000
Expert Solution
This question has been solved!
Explore an expertly crafted, step-by-step solution for a thorough understanding of key concepts.

Step by step
Solved in 2 steps

Knowledge Booster


Learn more about
Need a deep-dive on the concept behind this application? Look no further. Learn more about this topic, finance and related others by exploring similar questions and additional content below.Recommended textbooks for you
Essentials Of Investments
Finance
ISBN:
9781260013924
Author:
Bodie, Zvi, Kane, Alex, MARCUS, Alan J.
Publisher:
Mcgraw-hill Education,


Essentials Of Investments
Finance
ISBN:
9781260013924
Author:
Bodie, Zvi, Kane, Alex, MARCUS, Alan J.
Publisher:
Mcgraw-hill Education,

Foundations Of Finance
Finance
ISBN:
9780134897264
Author:
KEOWN, Arthur J., Martin, John D., PETTY, J. William
Publisher:
Pearson,

Fundamentals of Financial Management (MindTap Cou…
Finance
ISBN:
9781337395250
Author:
Eugene F. Brigham, Joel F. Houston
Publisher:
Cengage Learning

Corporate Finance (The Mcgraw-hill/Irwin Series i…
Finance
ISBN:
9780077861759
Author:
Stephen A. Ross Franco Modigliani Professor of Financial Economics Professor, Randolph W Westerfield Robert R. Dockson Deans Chair in Bus. Admin., Jeffrey Jaffe, Bradford D Jordan Professor
Publisher:
McGraw-Hill Education