
Database System Concepts
7th Edition
ISBN: 9780078022159
Author: Abraham Silberschatz Professor, Henry F. Korth, S. Sudarshan
Publisher: McGraw-Hill Education
expand_more
expand_more
format_list_bulleted
Related questions
Question
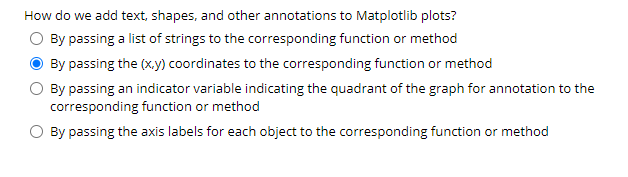

Transcribed Image Text:How do we add text, shapes, and other annotations to Matplotlib plots?
By passing a list of strings to the corresponding function or method
By passing the (x.y) coordinates to the corresponding function or method
By passing an indicator variable indicating the quadrant of the graph for annotation to the
corresponding function or method
By passing the axis labels for each object to the corresponding function or method
Expert Solution
This question has been solved!
Explore an expertly crafted, step-by-step solution for a thorough understanding of key concepts.

This is a popular solution

Trending nowThis is a popular solution!

Step by stepSolved in 2 steps

Knowledge Booster


Learn more about
Need a deep-dive on the concept behind this application? Look no further. Learn more about this topic, computer-science and related others by exploring similar questions and additional content below.Similar questions
- Using Java Create data-files/model/cube.off, an axis-aligned cube with unit edge lengths, centered at the origin.arrow_forwardGreetings I am trying to loop code over several FITS files to overlay several plots. At the moment I am only getting one graph (see pic) Ideally I would like to loop through several FITS that are in a folder on my Desktop. this is what I have so far. Im thinking that I will need to define a function to be able to do this. import numpy as npimport matplotlib.pyplot as pltfrom astropy.io import fitsfrom astropy.wcs import WCSfrom mpl_interactions import ioff, panhandler, zoom_factory%matplotlib widget spec_list = ['~/Desktop/r.HARPN.2018-01-18T14:25:36.145_CCF_A.fits', '~/Desktop/r.HARPN.2018-01-18T14:20:10.645_CCF_A.fits', '~/Desktop/r.HARPN.2018-01-18T14:31:00.875_CCF_A.fits', '~/Desktop/r.HARPN.2018-01-18T14:36:26.373_CCF_A.fits'] for i in spec_list: hdul = fits.open(i) data = hdul[1].data h1 = hdul[1].header flux = data[1] w = WCS(h1, naxis=1, relax=False, fix=False) lam = w.wcs_pix2world(np.arange(len(flux)), 0)[0]…arrow_forwardI would like to represent the "residuals" part of the code (see below) as a surface (meshplot), in essence a 3D plot of 2D data # Import librariesimport matplotlib.pyplot as pltimport globfrom astropy.io import fitsfrom astropy.wcs import WCSimport numpy as npimport seaborn as sns # Initial plotfig, ax = plt.subplots(figsize=(7, 7)) # Data from the FITSdata_dir = glob.glob('/Users/petrderuyter/Desktop/harpn_sun_release_package_ccf_2018/2018-04-02/*.fits') #'/Users/xxxxxxxxxxxx/Desktop/harpn_sun_release_package_ccf_2018/2018-01-18/*.fits' # Empty lists for storagelams = []fluxs = [] # Read the FITS files and extract datafor file_path in data_dir: hdul = fits.open(file_path) data = hdul[1].data h1 = hdul[1].header flux = data[1] w = WCS(h1, naxis=1, relax=False, fix=False) lam = w.wcs_pix2world(np.arange(len(flux)), 0)[0] lams.append(lam) fluxs.append(flux) ax.plot(lam, flux) # Calculate mean fluxmean_ccf = np.mean(fluxs, axis=0) # New figure for the mean…arrow_forward
- Use Python Codehow to filter dataframes using python . For example I have a student grade csv table, first, I need to read the csv using pandas library then I want to visualize my student scores (using matplotlib, seaborn, etc) but I only want to visualize those whose scores are 60 and above. so how do i do the code in python.Exampe of Student grades table (csv) : Student name Score Jojo 90 Lili 65 Bibi 50 Sarah 40 Rajah 100 Albert 80 Cherry 75 Jamie 85 So , based on the table above, what doesn't need to be visualized is Bibi and Sarah . Hope you can help me :)arrow_forwardCreate a vector x which ranges in values from -180 to 180 in steps of 10. Then let y = x. These values are in degrees. Find a variable z = cosd(x)’*sind(y); Use surf to plot the surface plot, and label using commands xlabel, ylabel, and zlabel. Add a title.arrow_forwardSo, one of these statements is correct? It is impossible to display on a single map several layers (data) using different coordinate systems. For GIS purposes, it is allowed for data to include several coordinate systems. A map may display several different layers of data, each with its own set of coordinates. A map's layers may not align correctly if you use several coordinate systems to display them. Those things are not includedarrow_forward
- An object is in location (1,3), (1,6), (3,9) and (3,6). Do two repeated scaling operations on the object with the scaling factors, (2,1) and (4,3). Write the new positions.arrow_forwardTask 4: Matplotlib Import the plotting function by the command: import matplotlib.pyplot as plt Plotting multiple lines Compute the x and y coordinates for points on sine and cosine curves and plot them on the same graph using matplotlib. Add x and y labels to the graph as well. Note: Please provide PYTHON (ANACONDA) code for above task.arrow_forwardwhy is this function throwing an error? Please show correct versionarrow_forward
- x = zeros(uint8(5,5)); for i = 1:5 for j = 1:5 a = 5/i; x(i,j) = 255/a; end end Which of the following best describes the black and white image x? 1. The columns of x will get lighter from left to right 2. The rows of x will get lighter from top to bottom 3. The rows of x will get darker from top to bottom 4. The columns of x will get darker from left to rightarrow_forwardI am trying to loop through several FITS files that are located on my Desktop. This is the code I have so far. The final image that i need to produce is a "single plot". with multiple graphs overlayed (see image) import numpy as npimport matplotlib.pyplot as pltimport globfrom astropy.io import fitsfrom astropy.wcs import WCSfrom pathlib import Path%matplotlib inline%matplotlib widget plt.figure(figsize=(5,5))legends = [] def plot_fits_file(file_path): # used this data to test ---------- # lam = np.random.random(100) # flux = np.random.random(100) # -------------------- # below code will work when you have file # all the plot will be on single chart hdul = fits.open(file_path) data = hdul[1].data h1 = hdul[1].header flux = data[1] w = WCS(h1, naxis=1, relax=False, fix=False) lam = w.wcs_pix2world(np.arange(len(flux)), 0)[0] file_path = Path(file_path)if file_path.exists(): plot_fits_file(file_path) plt.show()else:…arrow_forwardSo, are these statements correct? It is impossible to display on a single map several layers (data) using different coordinate systems. For GIS purposes, it is allowed for data to include several coordinate systems. A map may display several different layers of data, each with its own set of coordinates. A map's layers may not align correctly if you use several coordinate systems to display them. Those things are not includedarrow_forward
arrow_back_ios
SEE MORE QUESTIONS
arrow_forward_ios
Recommended textbooks for you
- Database System ConceptsComputer ScienceISBN:9780078022159Author:Abraham Silberschatz Professor, Henry F. Korth, S. SudarshanPublisher:McGraw-Hill Education
 Starting Out with Python (4th Edition)Computer ScienceISBN:9780134444321Author:Tony GaddisPublisher:PEARSON
 Digital Fundamentals (11th Edition)Computer ScienceISBN:9780132737968Author:Thomas L. FloydPublisher:PEARSON
  C How to Program (8th Edition)Computer ScienceISBN:9780133976892Author:Paul J. Deitel, Harvey DeitelPublisher:PEARSON
 Database Systems: Design, Implementation, & Manag...Computer ScienceISBN:9781337627900Author:Carlos Coronel, Steven MorrisPublisher:Cengage Learning
 Programmable Logic ControllersComputer ScienceISBN:9780073373843Author:Frank D. PetruzellaPublisher:McGraw-Hill Education
Database System Concepts
Computer Science
ISBN:9780078022159
Author:Abraham Silberschatz Professor, Henry F. Korth, S. Sudarshan
Publisher:McGraw-Hill Education
Starting Out with Python (4th Edition)
Computer Science
ISBN:9780134444321
Author:Tony Gaddis
Publisher:PEARSON
Digital Fundamentals (11th Edition)
Computer Science
ISBN:9780132737968
Author:Thomas L. Floyd
Publisher:PEARSON
C How to Program (8th Edition)
Computer Science
ISBN:9780133976892
Author:Paul J. Deitel, Harvey Deitel
Publisher:PEARSON
Database Systems: Design, Implementation, & Manag...
Computer Science
ISBN:9781337627900
Author:Carlos Coronel, Steven Morris
Publisher:Cengage Learning
Programmable Logic Controllers
Computer Science
ISBN:9780073373843
Author:Frank D. Petruzella
Publisher:McGraw-Hill Education