
Elementary Linear Algebra (MindTap Course List)
8th Edition
ISBN: 9781305658004
Author: Ron Larson
Publisher: Cengage Learning
expand_more
expand_more
format_list_bulleted
Related questions
Question
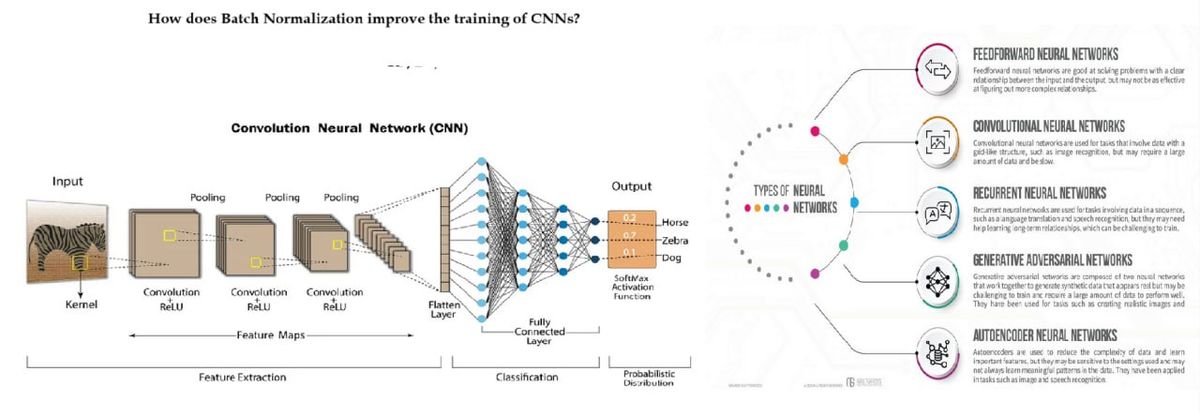

Transcribed Image Text:How does Batch Normalization improve the training of CNNs?
Convolution Neural Network (CNN)
Input
Pooling
Pooling
Pooling
Kernel
Convolution
ReLU
Convolution Convolution
ReLU
ReLU
Flatten
Layer
-Feature Maps-
Feature Extraction
Output
Horse
Zebra
Dog
SoftMax
Activation
Fully
-Connected-
Layer
Function
Classification
Probabilistic
Distribution
TYPES OF NEURAL
NETWORKS
FEEDFORWARD NEURAL NETWORKS
Feedforward neural networies are good at solving problems with a clear
ndationship between the input and the cutput but may not be as effective
at figuring out more complexreat onships.
CONVOLUTIONAL NEURAL NETWORKS
Convolutional neural networks are used for tasks that involve data with a
gid-like structure, such as image recognition, but may require a large
amount of data and be slow.
RECURRENT NEURAL NETWORKS
Recurrent neural networks are used for tasks involving cata in a sequence,
such as a language translation and speech recognition, but they may need
help learning long-term relationships, which can be challenging to train.
GENERATIVE ADVERSARIAL NETWORKS
Generative adversarial networks are composed of two neural networks
that work together to generate synthetic data that appears real but may be
challenging to train and require a large amount of data to perform well.
They have been used for tasks such as crating realistic images and
AUTOENCODER NEURAL NETWORKS
Autoencoders are used to reduce the complexity of data and learn
important features, but they may be sarsitive to the settings used ane may
not always leam meaningful patterns in the date. They have been applied
in tasks such as image and speech recognition
Expert Solution
This question has been solved!
Explore an expertly crafted, step-by-step solution for a thorough understanding of key concepts.

Step by stepSolved in 2 steps

Knowledge Booster

Similar questions
- Learning math Developers of a new math curriculumcalled “Accelerated Math” compared performances ofstudents taught by their system with control groups ofstudents in the same schools who were taught using traditional instructional methods and materials. Statis-tics about pretest and posttest scores are shown in the table. (J. Ysseldyke and S. Tardrew, Differentiating MathInstruction, Renaissance Learning, 2002)a) Did the groups differ in average math score at thestart of this study? b) Did the group taught using the Accelerated Math pro-gram show a significant improvement in test scores? c) Did the control group show a significant improve-ment in test scores? d) Were gains significantly higher for the AcceleratedMath group than for the control group? Instructional MethodAcc. math ControlNumber of students 231 245Pretest Mean 560.01 549.65St. Dev 84.29 74.68Post-test Mean 637.55 588.76St. Dev 82.9 83.24Individual gain Mean 77.53 39.11St. Dev. 78.01 66.25arrow_forwardMathematically discuss the role that SST.SSR and SSE play in the determination of the coefficient of determination within a linear least-squares analysisarrow_forwardThe extending research findings and conclusions from a study conducted on a sample population to the population at large is called? Transferability Generalizability Causality All of the abovearrow_forward
- An article in the Journal of Database Management "Experimental Study of a Self-Tuning Algorithm for DBMS Buffer Pools," (2005, Vol. 16, pp. 1-20) provided the workload used in the TPC-C OLTP (Transaction Processing Performance Council's Version C On-Line Transaction Processing) benchmark, which simulates a typical order entry application. Average frequencies and operations in TPC-c Transaction Frequency Selects Updates Inserts Deletes Non-unique Joins Selects New order 43 23 11 12 Payment 44 4.2 3. 0.6 Order Status 4 11.4 0.6 Delivery 5 130 120 10 Stock Level 4 1 The frequency of each type of transaction (in the second column) can be used as the percentage of each type of transaction. Let X, Y, and Z denote the average number of selects, updates, and inserts operations required for each type of transaction, respectively. Calculate the following: (c) P(X < 6, Y < 6|Z = 0) = Round your answer to three decimal places (e.g. i 98.765). (d) E(X | Y = 0, Z = 0) Round your answer to one…arrow_forwardDisk drives once more Here are the residuals for aregression of Price on Capacity for the hard drives ofExercise 18.a) Which residual contributes the most to the sum that isminimized by the Least Squares criterion?b) Two of the residuals are negative. What does that meanabout those drives? Be specific and use the correct units.arrow_forwardA landscaping company has collected data on home values (in thousands of $) and expenditures (in thousands of $) on landscaping with the hope of developing a predictive model to help marketing to potential new clients. Suppose the following table represents data for 14 households. Home Value Landscaping Expenditures ($1,000) ($1,000) 241 8.2 322 10.7 197 12.1 340 16.3 300 15.7 400 18.8 800 23.5 200 9.5 522 17.5 546 22.0 438 12.2 463 13.5 635 17.8 357 13.8 (a) Develop a scatter diagram with home value as the independent variable. 900 900 800 800 20 20 700 700 600 600 15 15 500 500 400 400 300 300 200 200 100 100 100 200 300 400 500 600 700 800 900 10 15 20 25 100 200 300 400 500 600 700 800 900 5 10 15 20 25 Home Value ($1,000) Landscaping Expenditures ($1,000) Home Value ($1,000) Landscaping Expenditures ($1,000) Landscaping Expenditures ($1,000) Home Value ($1,000) Landscaping Expenditures ($1,000) Home Value ($1,000)arrow_forward
- 2arrow_forwardWhat measures of fit are typically used to assess binary dependent variableregression models?arrow_forwardA state's park system statistical report for the 2014/2015 fiscal year gave the accompanying data on x = amount of money collected in user fees (in thousands of dollars) and y = operating cost (in thousands of dollars) for nine state parks in a certain district. y 4000 3000 2000 1000 User Fees (thousands of dollars) y 4000 3000 2000 1000 17 74 (a) Construct a scatterplot of these data. 811 380 33 427 500 734 760 200 200 400 Operating Costs (thousands of dollars) 400 + 600 600 101 355 3,546 1,391 243 752 1,054 2,227 1,604 800 800 Describe any interesting features of the scatterplot. There is a positive X y 4000 3000 2000 1000 0 y 4000 3000 2000 1000 200 200 400 400 (b) Find the equation of the least squares line. (Round your answers to four decimal places.) ŷ = 600 600 linear relationship between user fees collected and operating costs. 800 800arrow_forward
arrow_back_ios
SEE MORE QUESTIONS
arrow_forward_ios
Recommended textbooks for you
- Elementary Linear Algebra (MindTap Course List)AlgebraISBN:9781305658004Author:Ron LarsonPublisher:Cengage Learning
 Big Ideas Math A Bridge To Success Algebra 1: Stu...AlgebraISBN:9781680331141Author:HOUGHTON MIFFLIN HARCOURTPublisher:Houghton Mifflin Harcourt
Elementary Linear Algebra (MindTap Course List)
Algebra
ISBN:9781305658004
Author:Ron Larson
Publisher:Cengage Learning
Big Ideas Math A Bridge To Success Algebra 1: Stu...
Algebra
ISBN:9781680331141
Author:HOUGHTON MIFFLIN HARCOURT
Publisher:Houghton Mifflin Harcourt