City 1 2 3 4 5 6 7 8 9 10 11 12 13 14 15 16 17 18 19 20 Q 32.92 28.51 33.94 33.45 35.68 29.01 30.68 43.14 20.84 31.27 35.45 32.14 43.02 34.73 43.14 33.17 41.59 32.1 45.74 35.92 P 1.89 1.94 1.99 2.04 2.09 1.89 1.94 1.99 2.04 2.09 1.89 1.94 1.99 2.04 2.09 1.89 1.94 1.99 2.04 2.09 I 32.4 29.9 29.1 28.6 30.2 31.4 30.3 30.4 28.6 26.3 26.5 29.5 29.1 31.2 23.8 28.8 29.3 27.4 27.8 30.2 A 4.38 4.12 5.06 5.36 5.38 3.47 4.06 5.29 3.39 5.12 4.44 4.18 5.57 3.57 6.43 3.95 4.04 4.36 5.81 4.63 Psub 2.08 2.06 2.15 2.18 2.18 1.99 2.05 2.17 1.98 2.16 2.09 2.06 2.2 2 2.39 2.04 2.05 2.08 2.23 2.11 Pop 98.7 104.5 105.1 106.9 108.9 115.2 117.8 120.2 120.8 122.7 122.9 124.6 125.8 131.9 133.1 135.6 136.5 141.8 144.8 150.1 Log Q Log P Log I Log A Log Psub Log Pop 3.49408 0.636577 3.478158 1.477049 0.732368 4.592085 3.350255 0.662688 3.397858 1.415853 0.722706 4.649187 3.524594 0.688135 3.370738 1.621366 0.765468 4.654912 3.510052 0.71295 3.353407 1.678964 0.779325 4.671894 3.57459 0.737164 3.407842 1.682688 0.779325 4.69043 3.367641 0.636577 3.446808 1.244155 0.688135 4.74667 3.423611 0.662688 3.411148 1.401183 0.71784 4.768988 3.764451 0.688135 3.414443 1.665818 0.774727 4.789157 3.036874 0.71295 3.353407 1.22083 0.683097 4.794136 3.442659 0.737164 3.269569 1.633154 0.770108 4.809742 3.568123 0.636577 3.277145 1.490654 0.737164 4.811371 3.470101 0.662688 3.38439 1.430311 0.722706 4.825109 3.761665 0.688135 3.370738 1.717395 0.788457 4.834693 3.547604 0.71295 3.440418 1.272566 0.693147 4.882044 3.764451 0.737164 3.169686 1.860975 0.871293 4.891101 3.501646 0.636577 3.360375 1.373716 0.71295 4.909709 3.72786 0.662688 3.377588 1.396245 0.71784 4.916325 3.468856 0.688135 3.310543 1.472472 0.732368 4.954418 3.822973 0.71295 3.325036 1.759581 0.802002 4.975353 3.581294 0.737164 3.407842 1.532557 0.746688 5.011302
City 1 2 3 4 5 6 7 8 9 10 11 12 13 14 15 16 17 18 19 20 Q 32.92 28.51 33.94 33.45 35.68 29.01 30.68 43.14 20.84 31.27 35.45 32.14 43.02 34.73 43.14 33.17 41.59 32.1 45.74 35.92 P 1.89 1.94 1.99 2.04 2.09 1.89 1.94 1.99 2.04 2.09 1.89 1.94 1.99 2.04 2.09 1.89 1.94 1.99 2.04 2.09 I 32.4 29.9 29.1 28.6 30.2 31.4 30.3 30.4 28.6 26.3 26.5 29.5 29.1 31.2 23.8 28.8 29.3 27.4 27.8 30.2 A 4.38 4.12 5.06 5.36 5.38 3.47 4.06 5.29 3.39 5.12 4.44 4.18 5.57 3.57 6.43 3.95 4.04 4.36 5.81 4.63 Psub 2.08 2.06 2.15 2.18 2.18 1.99 2.05 2.17 1.98 2.16 2.09 2.06 2.2 2 2.39 2.04 2.05 2.08 2.23 2.11 Pop 98.7 104.5 105.1 106.9 108.9 115.2 117.8 120.2 120.8 122.7 122.9 124.6 125.8 131.9 133.1 135.6 136.5 141.8 144.8 150.1 Log Q Log P Log I Log A Log Psub Log Pop 3.49408 0.636577 3.478158 1.477049 0.732368 4.592085 3.350255 0.662688 3.397858 1.415853 0.722706 4.649187 3.524594 0.688135 3.370738 1.621366 0.765468 4.654912 3.510052 0.71295 3.353407 1.678964 0.779325 4.671894 3.57459 0.737164 3.407842 1.682688 0.779325 4.69043 3.367641 0.636577 3.446808 1.244155 0.688135 4.74667 3.423611 0.662688 3.411148 1.401183 0.71784 4.768988 3.764451 0.688135 3.414443 1.665818 0.774727 4.789157 3.036874 0.71295 3.353407 1.22083 0.683097 4.794136 3.442659 0.737164 3.269569 1.633154 0.770108 4.809742 3.568123 0.636577 3.277145 1.490654 0.737164 4.811371 3.470101 0.662688 3.38439 1.430311 0.722706 4.825109 3.761665 0.688135 3.370738 1.717395 0.788457 4.834693 3.547604 0.71295 3.440418 1.272566 0.693147 4.882044 3.764451 0.737164 3.169686 1.860975 0.871293 4.891101 3.501646 0.636577 3.360375 1.373716 0.71295 4.909709 3.72786 0.662688 3.377588 1.396245 0.71784 4.916325 3.468856 0.688135 3.310543 1.472472 0.732368 4.954418 3.822973 0.71295 3.325036 1.759581 0.802002 4.975353 3.581294 0.737164 3.407842 1.532557 0.746688 5.011302

College Algebra (MindTap Course List)
12th Edition
ISBN:9781305652231
Author:R. David Gustafson, Jeff Hughes
Publisher:R. David Gustafson, Jeff Hughes
Chapter8: Sequences, Series, And Probability
Section8.CR: Chapter Review
Problem 37E: Find the positive geometric mean between 4 and 64.

Related questions
Question
100%
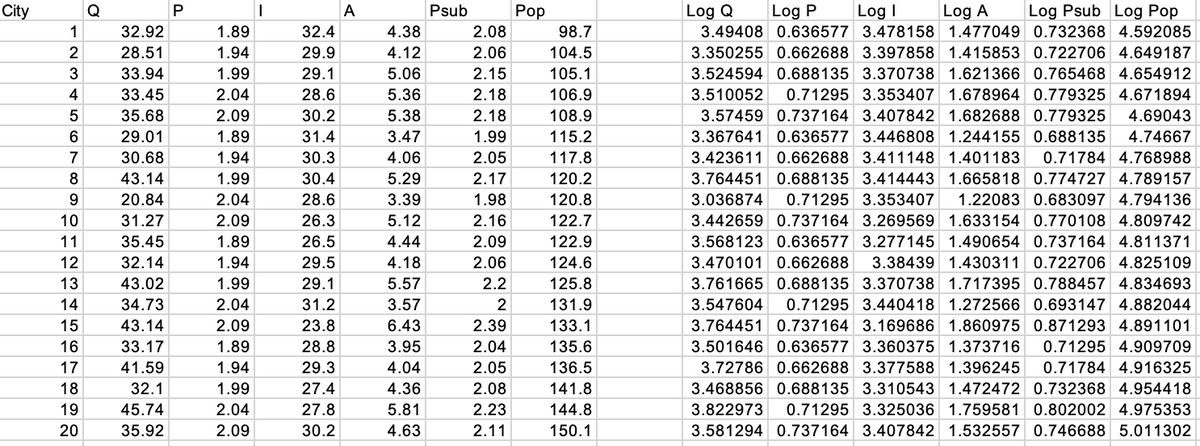
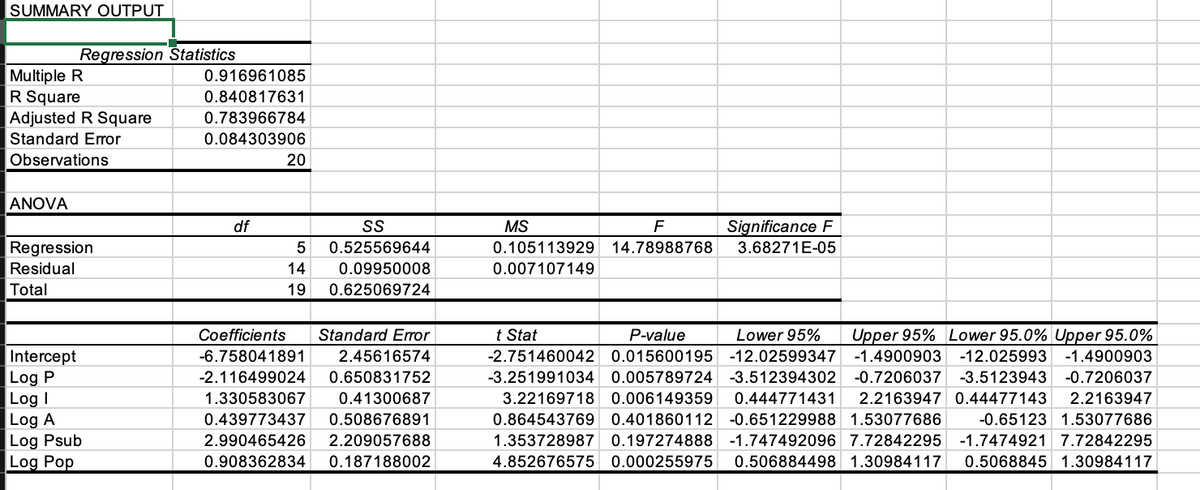
- Describe the patterns in quantity sold and own and rival prices during this time period using basic
descriptive statistics . Graphs are welcome as well. - Take the logs of the variables, and estimate the demand
function .- Interpret the R-square.
- Interpret the coefficients for logP and logPsub
- Interpret the p-values associated with each independent variable
- Are consumers price sensitive? Why or why not? (be as precise as you can – you have estimates!). Does this price sensitivity make sense given the good we are examining?
- How sensitive are our consumers to changes in the rival good’s price? Explain in detail.
- Suppose we decide to charge a per ounce price of $2, while at the same time our rival charges a price of $2.15. All else equal, what would you expect sales to be? How confident are you in your forecast?
- Suppose we are charging a price of $2 and our current marginal cost is $1.50 Are we maximizing profits at this price? If not, should we raise or lower price? Why?
Transcribed Image Text:City
Q
1
2
WN
3
4
5
6
7
8
600
9
10
11
12
13
14
15
16
17
18
19
20
32.92
28.51
33.94
33.45
35.68
29.01
30.68
43.14
20.84
31.27
35.45
32.14
43.02
34.73
43.14
33.17
41.59
32.1
45.74
35.92
P
1.89
1.94
1.99
2.04
2.09
1.89
1.94
1.99
2.04
2.09
1.89
1.94
1.99
2.04
2.09
1.89
1.94
1.99
2.04
2.09
I
32.4
29.9
29.1
28.6
30.2
31.4
30.3
30.4
28.6
26.3
26.5
29.5
29.1
31.2
23.8
28.8
29.3
27.4
27.8
30.2
A
4.38
4.12
5.06
5.36
5.38
3.47
4.06
5.29
3.39
5.12
4.44
4.18
5.57
3.57
6.43
3.95
4.04
4.36
5.81
4.63
Psub
2.08
2.06
2.15
2.18
2.18
1.99
2.05
2.17
1.98
2.16
2.09
2.06
2.2
2
2.39
2.04
2.05
2.08
2.23
2.11
Pop
98.7
104.5
105.1
106.9
108.9
115.2
117.8
120.2
120.8
122.7
122.9
124.6
125.8
131.9
133.1
135.6
136.5
141.8
144.8
150.1
Log A Log Psub Log Pop
Log Q Log P Log I
3.49408 0.636577 3.478158 1.477049 0.732368 4.592085
3.350255 0.662688 3.397858 1.415853 0.722706 4.649187
3.524594 0.688135 3.370738 1.621366 0.765468 4.654912
3.510052 0.71295 3.353407 1.678964 0.779325 4.671894
3.57459 0.737164 3.407842 1.682688 0.779325 4.69043
3.367641 0.636577 3.446808 1.244155 0.688135 4.74667
3.423611 0.662688 3.411148 1.401183 0.71784 4.768988
3.764451 0.688135 3.414443 1.665818 0.774727 4.789157
3.036874 0.71295 3.353407 1.22083 0.683097 4.794136
3.442659 0.737164 3.269569 1.633154 0.770108 4.809742
3.568123 0.636577 3.277145 1.490654 0.737164 4.811371
3.470101 0.662688 3.38439 1.430311 0.722706 4.825109
3.761665 0.688135 3.370738 1.717395 0.788457 4.834693
3.547604 0.71295 3.440418 1.272566 0.693147 4.882044
3.764451 0.737164 3.169686 1.860975 0.871293 4.891101
3.501646 0.636577 3.360375 1.373716 0.71295 4.909709
3.72786 0.662688 3.377588 1.396245 0.71784 4.916325
3.468856 0.688135 3.310543 1.472472 0.732368 4.954418
3.822973 0.71295 3.325036 1.759581 0.802002 4.975353
3.581294 0.737164 3.407842 1.532557 0.746688 5.011302
Transcribed Image Text:SUMMARY OUTPUT
Multiple R
R Square
Adjusted R Square
Standard Error
Observations
ANOVA
Regression
Residual
Total
Intercept
Log P
Log I
Log A
Log Psub
Log Pop
Regression Statistics
0.916961085
0.840817631
0.783966784
0.084303906
20
df
5
SS
0.525569644
0.09950008
14
19 0.625069724
Coefficients Standard Error
-6.758041891 2.45616574
-2.116499024 0.650831752
1.330583067 0.41300687
0.439773437 0.508676891
2.990465426 2.209057688
0.908362834 0.187188002
MS
F
Significance F
3.68271E-05
0.105113929 14.78988768
0.007107149
t Stat
P-value
Lower 95% Upper 95% Lower 95.0% Upper 95.0%
-2.751460042 0.015600195 -12.02599347 -1.4900903 -12.025993 -1.4900903
-3.251991034 0.005789724 -3.512394302 -0.7206037 -3.5123943 -0.7206037
3.22169718 0.006149359 0.444771431 2.2163947 0.44477143 2.2163947
0.864543769 0.401860112 -0.651229988 1.53077686 -0.65123 1.53077686
1.353728987 0.197274888 -1.747492096 7.72842295 -1.7474921 7.72842295
4.852676575 0.000255975 0.506884498 1.30984117 0.5068845 1.30984117
Expert Solution
This question has been solved!
Explore an expertly crafted, step-by-step solution for a thorough understanding of key concepts.

This is a popular solution!

Trending now
This is a popular solution!

Step by step
Solved in 4 steps with 4 images

Follow-up Questions
Read through expert solutions to related follow-up questions below.
Follow-up Question
Could you answer these three as well? My apologies for not clarifiying these are the ones I really need help with. I do provide positive feedback and votes for who answers. Thank you!
- How sensitive are our consumers to changes in the rival good’s price? Explain in detail.
- Suppose we decide to charge a per ounce price of $2, while at the same time our rival charges a price of $2.15. All else equal, what would you expect sales to be? How confident are you in your forecast?
- Suppose we are charging a price of $2 and our current marginal cost is $1.50 Are we maximizing profits at this price? If not, should we raise or lower price? Why?

Transcribed Image Text:City
Q
1
2
WN
3
4
5
6
7
8
600
9
10
11
12
13
14
15
16
17
18
19
20
32.92
28.51
33.94
33.45
35.68
29.01
30.68
43.14
20.84
31.27
35.45
32.14
43.02
34.73
43.14
33.17
41.59
32.1
45.74
35.92
P
1.89
1.94
1.99
2.04
2.09
1.89
1.94
1.99
2.04
2.09
1.89
1.94
1.99
2.04
2.09
1.89
1.94
1.99
2.04
2.09
I
32.4
29.9
29.1
28.6
30.2
31.4
30.3
30.4
28.6
26.3
26.5
29.5
29.1
31.2
23.8
28.8
29.3
27.4
27.8
30.2
A
4.38
4.12
5.06
5.36
5.38
3.47
4.06
5.29
3.39
5.12
4.44
4.18
5.57
3.57
6.43
3.95
4.04
4.36
5.81
4.63
Psub
2.08
2.06
2.15
2.18
2.18
1.99
2.05
2.17
1.98
2.16
2.09
2.06
2.2
2
2.39
2.04
2.05
2.08
2.23
2.11
Pop
98.7
104.5
105.1
106.9
108.9
115.2
117.8
120.2
120.8
122.7
122.9
124.6
125.8
131.9
133.1
135.6
136.5
141.8
144.8
150.1
Log A Log Psub Log Pop
Log Q Log P Log I
3.49408 0.636577 3.478158 1.477049 0.732368 4.592085
3.350255 0.662688 3.397858 1.415853 0.722706 4.649187
3.524594 0.688135 3.370738 1.621366 0.765468 4.654912
3.510052 0.71295 3.353407 1.678964 0.779325 4.671894
3.57459 0.737164 3.407842 1.682688 0.779325 4.69043
3.367641 0.636577 3.446808 1.244155 0.688135 4.74667
3.423611 0.662688 3.411148 1.401183 0.71784 4.768988
3.764451 0.688135 3.414443 1.665818 0.774727 4.789157
3.036874 0.71295 3.353407 1.22083 0.683097 4.794136
3.442659 0.737164 3.269569 1.633154 0.770108 4.809742
3.568123 0.636577 3.277145 1.490654 0.737164 4.811371
3.470101 0.662688 3.38439 1.430311 0.722706 4.825109
3.761665 0.688135 3.370738 1.717395 0.788457 4.834693
3.547604 0.71295 3.440418 1.272566 0.693147 4.882044
3.764451 0.737164 3.169686 1.860975 0.871293 4.891101
3.501646 0.636577 3.360375 1.373716 0.71295 4.909709
3.72786 0.662688 3.377588 1.396245 0.71784 4.916325
3.468856 0.688135 3.310543 1.472472 0.732368 4.954418
3.822973 0.71295 3.325036 1.759581 0.802002 4.975353
3.581294 0.737164 3.407842 1.532557 0.746688 5.011302

Transcribed Image Text:SUMMARY OUTPUT
Multiple R
R Square
Adjusted R Square
Standard Error
Observations
ANOVA
Regression
Residual
Total
Intercept
Log P
Log I
Log A
Log Psub
Log Pop
Regression Statistics
0.916961085
0.840817631
0.783966784
0.084303906
20
df
5
SS
0.525569644
0.09950008
14
19 0.625069724
Coefficients Standard Error
-6.758041891 2.45616574
-2.116499024 0.650831752
1.330583067 0.41300687
0.439773437 0.508676891
2.990465426 2.209057688
0.908362834 0.187188002
MS
F
Significance F
3.68271E-05
0.105113929 14.78988768
0.007107149
t Stat
P-value
Lower 95% Upper 95% Lower 95.0% Upper 95.0%
-2.751460042 0.015600195 -12.02599347 -1.4900903 -12.025993 -1.4900903
-3.251991034 0.005789724 -3.512394302 -0.7206037 -3.5123943 -0.7206037
3.22169718 0.006149359 0.444771431 2.2163947 0.44477143 2.2163947
0.864543769 0.401860112 -0.651229988 1.53077686 -0.65123 1.53077686
1.353728987 0.197274888 -1.747492096 7.72842295 -1.7474921 7.72842295
4.852676575 0.000255975 0.506884498 1.30984117 0.5068845 1.30984117
Solution
Recommended textbooks for you
College Algebra (MindTap Course List)
Algebra
ISBN:
9781305652231
Author:
R. David Gustafson, Jeff Hughes
Publisher:
Cengage Learning
College Algebra (MindTap Course List)
Algebra
ISBN:
9781305652231
Author:
R. David Gustafson, Jeff Hughes
Publisher:
Cengage Learning