
Chapter6: Random Errors In Chemical Analysis
Section: Chapter Questions
Problem 6.17QAP

Related questions
Question
I need help to produce a standard curve with the attached worksheet. The curve/graph should be absorbance versus concentration.
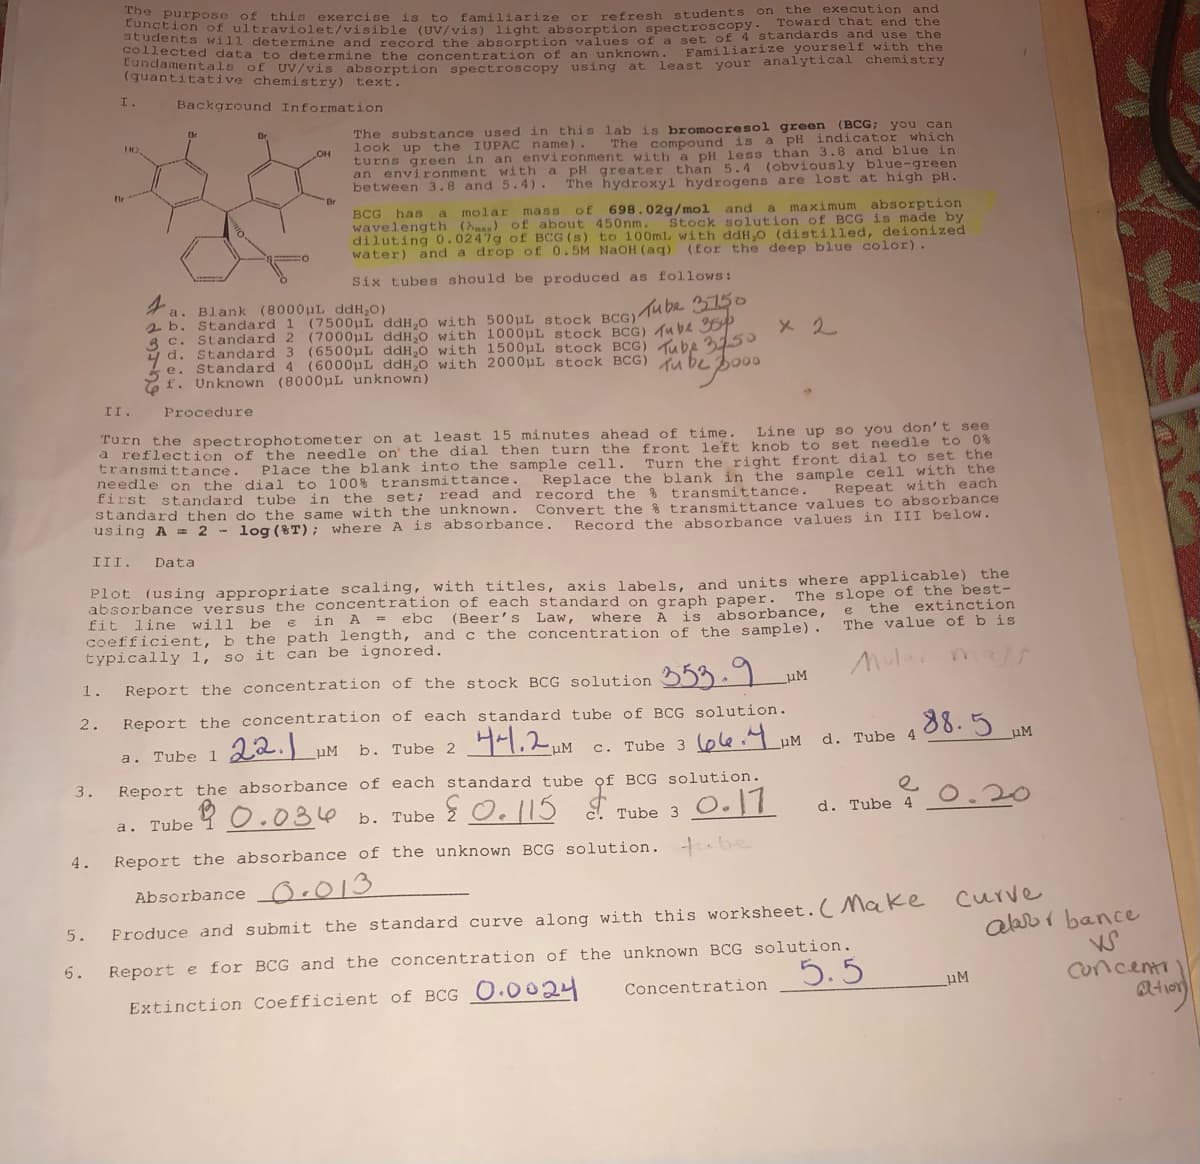
Transcribed Image Text:FuneuEpose of this exercise is to familiarize or refresh students on the execution and
Eunction of ultraviolet/visible (UV/vis) light absorption spectroscopy.
Toward that end the
CeenES will determine and record the absorption values of a set of 4 standards and use the
collected data t o determine the concentration of an unknown.
Familiarize yourself with the
Cundamentals of UV/vis absorption spectroscopy using at least your analytical chemistry
(quantitative chemistry) text.
I.
Background Information
The substance used in this lab is bromocresol green (BCG; you can
look up the IUPAC name).
turns green in an environment with a pH less than 3.8 and blue in
an environment with
between 3.8 and 5.4).
The compound is a pH indicator which
a pH greater than 5.4 (obviously blue-green
The hydroxyl hydrogens are lost at high pH.
Br
BCG has
wavelength (a) of about 450nm.
diluting 0.0247g of BCG (s) to 100ml, with ddH,0 (distilled, deionized
water) and a drop of 0.5M NAOH (aq)
a molar mass of 698.02g/mol and a maximum absorption
Stock solution of BCG is made by
(for the deep blue color).
Six tubes should be produced as follows:
a. Blank (8000pL ddH,0)
2 b. Standard 1 (7500ui ddH,0 with 500pL stock BCG) TU bR 20
A c. Standard 2 (7000uL ddH.0 with 1000uL stock BCG) 4ube DP
y d. Standard 3 (6500uL ddH,0 with 1500uL stock BCG) be 35°
e. Standard 4 (6000pL ddH 0 with 2000pL stock BCG) be ho00
f. Unknown (8000µL unknown)
II.
Procedure
Turn the spectrophotometer on at least 15 minutes ahead of time.
a reflection of the needle on the dial then turn the front left knob to set needle to 0%
transmittance.
needle on the dial to 100% transmittance.
first standard tube in the set; read and record the % transmittance.
standard then do the same with the unknown.
using A = 2 - log (&T); where A is absorbance,
Line up so you don't see
Place the blank into the sample cell.
Turn the right front dial to set the
Replace the blank in the sample cell with the
Repeat with each
Convert the % transmittance values to absorbance
Record the absorbance values in III below.
III.
Data
absorbance versus the concentration of each standard on graph paper.
fit line will be e
Plot (using appropriate scaling, with titles, axis labels, and units where applicable) the
The slope of the best-
extinction
in A = ebc (Beer's
where A is absorbance,
coefficient, b the path length, and c the concentration of the sample).
Law,
the
The value of bis
typically 1, so it can be ignored.
1.
Report the concentration of the stock BCG solution 353.
2.
Report the concentration of each standard tube of BCG solution.
88.5
b. Tube 2 H-.2.M
c. Tube 3 (ple4 uM
uM
a. Tube 1 22.
µM
d. Tube 4
3.
Report the absorbance of each standard tube of BCG solution.
0.20
a. Tube 9 O.034 b. Tube
Tube 3 O. 7
d. Tube 4
Report the absorbance of the unknown BCG solution.
tube
4.
Absorbance O.013
Curve
5.
Produce and submit the standard curve along with this worksheet.( Make
albr i bance
6.
Report e for BCG and the concentration of the unknown BCG solution,
5.5
Concenti
@tion
Concentration
Extinction Coefficient of BCG O.0024
Expert Solution
This question has been solved!
Explore an expertly crafted, step-by-step solution for a thorough understanding of key concepts.

This is a popular solution!

Trending now
This is a popular solution!

Step by step
Solved in 2 steps with 1 images

Knowledge Booster


Learn more about
Need a deep-dive on the concept behind this application? Look no further. Learn more about this topic, chemistry and related others by exploring similar questions and additional content below.Recommended textbooks for you

Principles of Instrumental Analysis
Chemistry
ISBN:
9781305577213
Author:
Douglas A. Skoog, F. James Holler, Stanley R. Crouch
Publisher:
Cengage Learning

Principles of Modern Chemistry
Chemistry
ISBN:
9781305079113
Author:
David W. Oxtoby, H. Pat Gillis, Laurie J. Butler
Publisher:
Cengage Learning
Principles of Instrumental Analysis
Chemistry
ISBN:
9781305577213
Author:
Douglas A. Skoog, F. James Holler, Stanley R. Crouch
Publisher:
Cengage Learning
Principles of Modern Chemistry
Chemistry
ISBN:
9781305079113
Author:
David W. Oxtoby, H. Pat Gillis, Laurie J. Butler
Publisher:
Cengage Learning

Physical Chemistry
Chemistry
ISBN:
9781133958437
Author:
Ball, David W. (david Warren), BAER, Tomas
Publisher:
Wadsworth Cengage Learning,

Chemistry for Engineering Students
Chemistry
ISBN:
9781285199023
Author:
Lawrence S. Brown, Tom Holme
Publisher:
Cengage Learning