Imagine that you run the toll authority for a city bridge. You must charge all of your customers the exact same toll. Initially, you have set the price at $2 per trip. The blue line on the following graph shows the weekly demand curve for trips across the city bridge. On the following graph, use the purple rectangle (diamond symbols) to shade the area representing the total weekly revenue when the toll is $2 on the graph. Notice that when you click on the rectangle, the area is displayed. (? 10 TR at $2 8 Demand 7 TR at $3 5 2 1 8 12 16 20 24 28 32 38 40 QUANTITY (Thousands of vehicles per week) An advisor has suggested that if you raise the toll to $3, the toll authority would bring in more revenue. To analyze this, use the green rectangle (triangle symbols) to shade the area representing the total weekly revenue when the toll is $3 on the graph. When the toll is $2, total revenue is S per week, but when the toll is $3, total revenue is $ per week. Based on your analysis, you can conclude that your advisor is * in suggesting that total revenue would rise if you increase the toll from $2 to $3, because the demand for trips across the bridge for prices between $2 and $3 is OLL (Dollars per vehide)
Imagine that you run the toll authority for a city bridge. You must charge all of your customers the exact same toll. Initially, you have set the price at $2 per trip. The blue line on the following graph shows the weekly demand curve for trips across the city bridge. On the following graph, use the purple rectangle (diamond symbols) to shade the area representing the total weekly revenue when the toll is $2 on the graph. Notice that when you click on the rectangle, the area is displayed. (? 10 TR at $2 8 Demand 7 TR at $3 5 2 1 8 12 16 20 24 28 32 38 40 QUANTITY (Thousands of vehicles per week) An advisor has suggested that if you raise the toll to $3, the toll authority would bring in more revenue. To analyze this, use the green rectangle (triangle symbols) to shade the area representing the total weekly revenue when the toll is $3 on the graph. When the toll is $2, total revenue is S per week, but when the toll is $3, total revenue is $ per week. Based on your analysis, you can conclude that your advisor is * in suggesting that total revenue would rise if you increase the toll from $2 to $3, because the demand for trips across the bridge for prices between $2 and $3 is OLL (Dollars per vehide)

Principles of Economics 2e
2nd Edition
ISBN:9781947172364
Author:Steven A. Greenlaw; David Shapiro
Publisher:Steven A. Greenlaw; David Shapiro
Chapter5: Elasticity
Section: Chapter Questions
Problem 29CTQ: A city has build a bridge over a river and it decides to charge a toll to everyone who crosses. For...

Related questions
Question
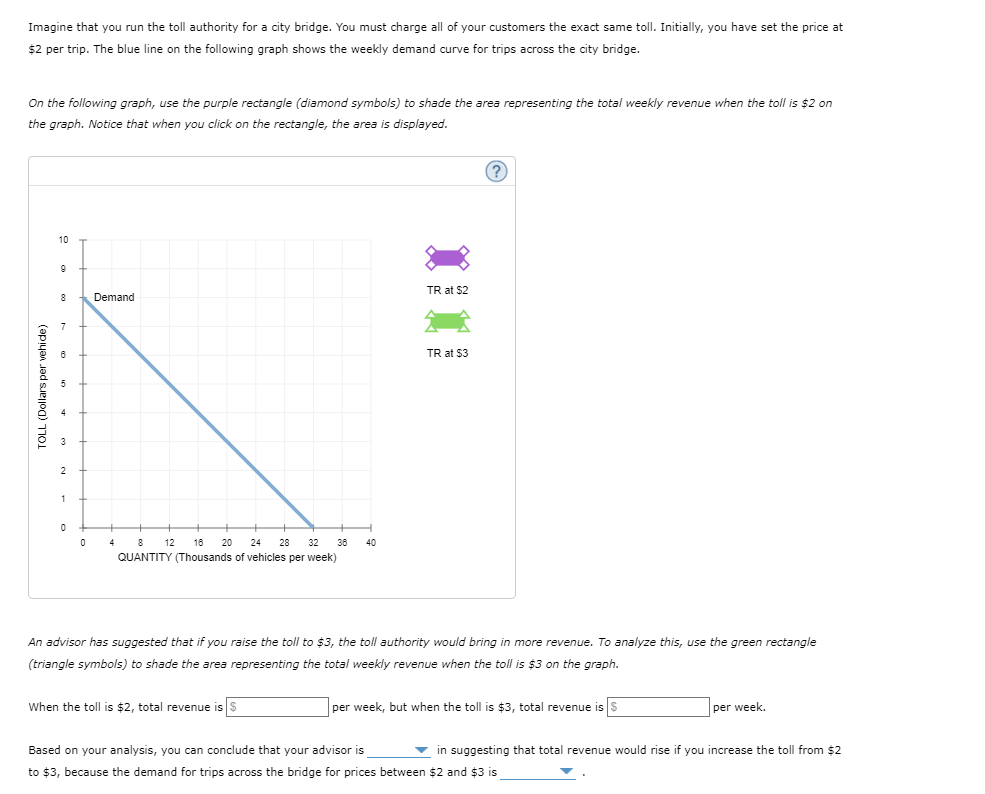
Transcribed Image Text:Imagine that you run the toll authority for a city bridge. You must charge all of your customers the exact same toll. Initially, you have set the price at
$2 per trip. The blue line on the following graph shows the weekly demand curve for trips across the city bridge.
On the following graph, use the purple rectangle (diamond symbols) to shade the area representing the total weekly revenue when the toll is $2 on
the graph. Notice that when you click on the rectangle, the area is displayed.
(?
10
TR at $2
8
Demand
7
TR at $3
5
2
1
8
12
16
20
24
28
32
38 40
QUANTITY (Thousands of vehicles per week)
An advisor has suggested that
you raise the toll to $3, the toll authority would bring in more revenue. To analyze this, use the green rectangle
(triangle symbols) to shade the area representing the total weekly revenue when the toll is $3 on the graph.
When the toll is $2, total revenue is S
per week, but when the toll is $3, total revenue is $
per week.
Based on your analysis, you can conclude that your advisor is
- in suggesting that total revenue would rise if you increase the toll from $2
to $3, because the demand for trips across the bridge for prices between $2 and $3 is
OLL (Dollars per vehide)
Expert Solution
This question has been solved!
Explore an expertly crafted, step-by-step solution for a thorough understanding of key concepts.

This is a popular solution!

Trending now
This is a popular solution!

Step by step
Solved in 4 steps with 2 images

Knowledge Booster


Learn more about
Need a deep-dive on the concept behind this application? Look no further. Learn more about this topic, economics and related others by exploring similar questions and additional content below.Recommended textbooks for you
Principles of Economics 2e
Economics
ISBN:
9781947172364
Author:
Steven A. Greenlaw; David Shapiro
Publisher:
OpenStax

Exploring Economics
Economics
ISBN:
9781544336329
Author:
Robert L. Sexton
Publisher:
SAGE Publications, Inc

Economics (MindTap Course List)
Economics
ISBN:
9781337617383
Author:
Roger A. Arnold
Publisher:
Cengage Learning
Principles of Economics 2e
Economics
ISBN:
9781947172364
Author:
Steven A. Greenlaw; David Shapiro
Publisher:
OpenStax
Exploring Economics
Economics
ISBN:
9781544336329
Author:
Robert L. Sexton
Publisher:
SAGE Publications, Inc
Economics (MindTap Course List)
Economics
ISBN:
9781337617383
Author:
Roger A. Arnold
Publisher:
Cengage Learning

