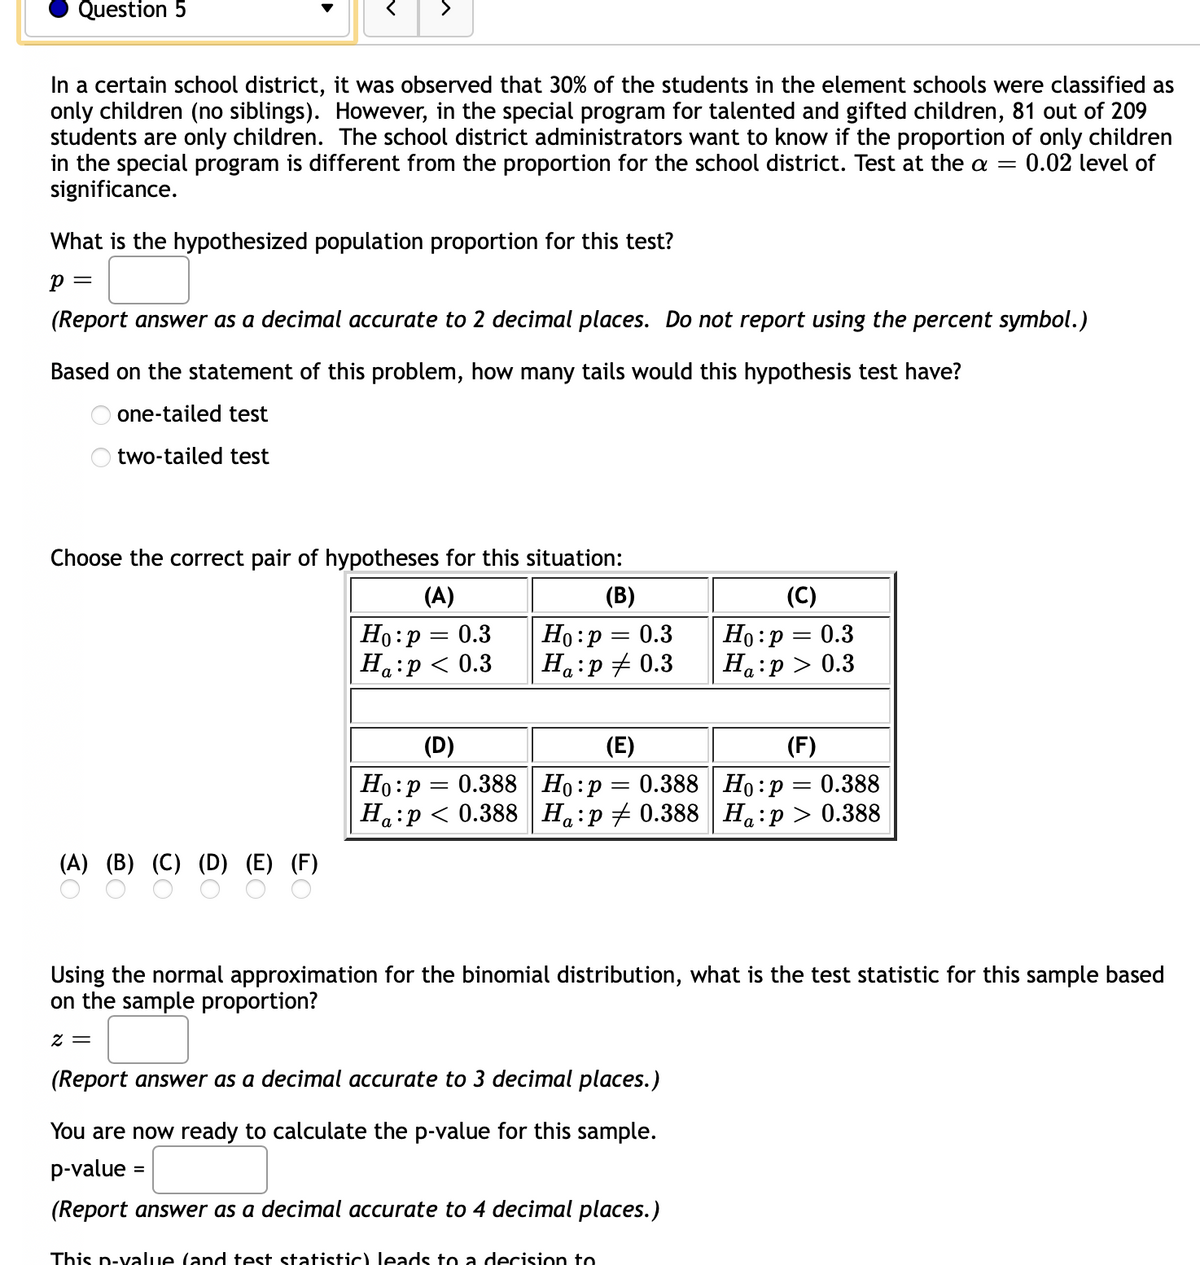
In a certain school district, it was observed that 30% of the students in the element schools were classified as only children (no siblings). However, in the special program for talented and gifted children, 81 out of 209 students are only children. The school district administrators want to know if the proportion of only children in the special program is different from the proportion for the school district. Test at the a = 0.02 level of significance.
In a certain school district, it was observed that 30% of the students in the element schools were classified as only children (no siblings). However, in the special program for talented and gifted children, 81 out of 209 students are only children. The school district administrators want to know if the proportion of only children in the special program is different from the proportion for the school district. Test at the a = 0.02 level of significance.

College Algebra (MindTap Course List)
12th Edition
ISBN:9781305652231
Author:R. David Gustafson, Jeff Hughes
Publisher:R. David Gustafson, Jeff Hughes
Chapter8: Sequences, Series, And Probability
Section8.7: Probability
Problem 58E: What is meant by the sample space of an experiment?

Related questions

Topic Video
Question
Transcribed Image Text:Question 5
>
In a certain school district, it was observed that 30% of the students in the element schools were classified as
only children (no siblings). However, in the special program for talented and gifted children, 81 out of 209
students are only children. The school district administrators want to know if the proportion of only children
in the special program is different from the proportion for the school district. Test at the a =
significance.
0.02 level of
What is the hypothesized population proportion for this test?
p =
(Report answer as a decimal accurate to 2 decimal places. Do not report using the percent symbol.)
Based on the statement of this problem, how many tails would this hypothesis test have?
one-tailed test
two-tailed test
Choose the correct pair of hypotheses for this situation:
(A)
(B)
(C)
Ho:p = 0.3
Ha:p < 0.3
Ho :p
Ha:p # 0.3
Но: р — 0.3
Ha:p > 0.3
0.3
(D)
(E)
(F)
Но: р — 0.388 | Но:р — 0.388 | Но : р — 0.388
Ha:p < 0.388
%3D
Ha:p + 0.388 Ha:p > 0.388
(A) (B) (C) (D) (E) (F)
Using the normal approximation for the binomial distribution, what is the test statistic for this sample based
on the sample proportion?
= Z
(Report answer as a decimal accurate to 3 decimal places.)
You are now ready to calculate the p-value for this sample.
p-value :
%3D
(Report answer as a decimal accurate to 4 decimal places.)
This p-value (and test statistic) leads to a decision to
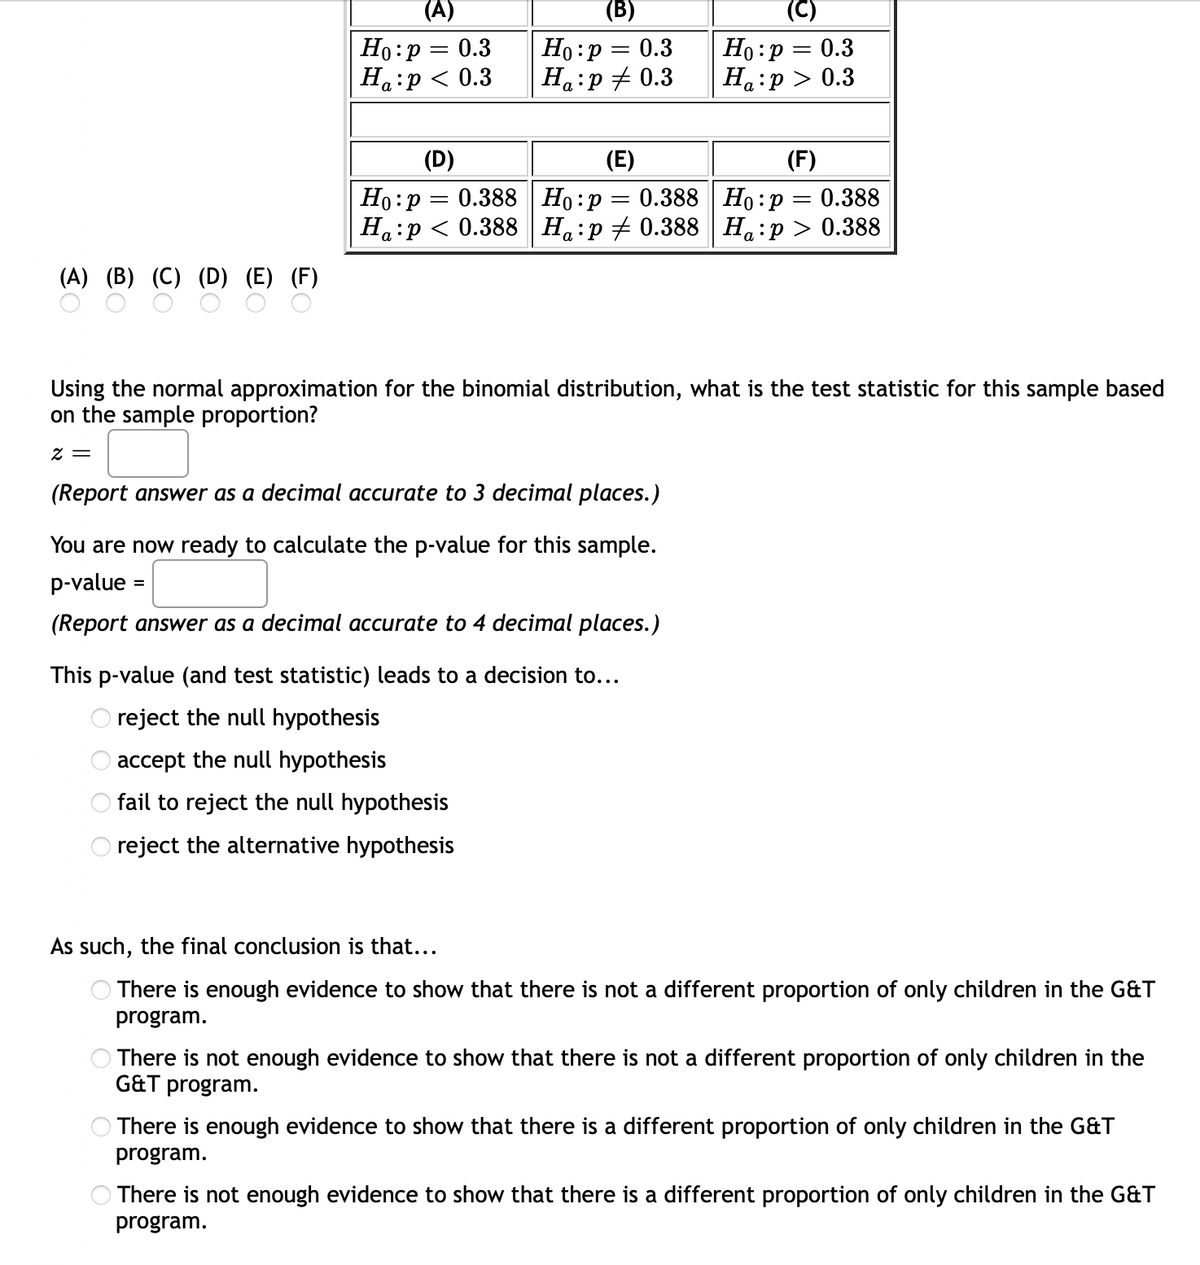
Transcribed Image Text:(А)
(B)
(C)
Ho:p = 0.3
Ha:p < 0.3
Но: р — 0.3
Ha:p + 0.3
Ho :p = 0.3
На:р> 0.3
(D)
(E)
(F)
Но:р — 0.388| Но:р
Ha:p < 0.388 H:p + 0.388 H:p > 0.388
0.388 Ho:p = 0.388
(A) (B) (C) (D) (E) (F)
Using the normal approximation for the binomial distribution, what is the test statistic for this sample based
on the sample proportion?
z =
(Report answer as a decimal accurate to 3 decimal places.)
You are now ready to calculate the p-value for this sample.
p-value
(Report answer as a decimal accurate to 4 decimal places.)
This p-value (and test statistic) leads to a decision to...
O reject the null hypothesis
O accept the null hypothesis
fail to reject the null hypothesis
reject the alternative hypothesis
As such, the final conclusion is that...
There is enough evidence to show that there is not a different proportion of only children in the G&T
program.
There is not enough evidence to show that there is not a different proportion of only children in the
G&T program.
There is enough evidence to show that there is a different proportion of only children in the G&T
program.
There is not enough evidence to show that there is a different proportion of only children in the G&T
program.
Expert Solution
This question has been solved!
Explore an expertly crafted, step-by-step solution for a thorough understanding of key concepts.

Step by step
Solved in 3 steps

Knowledge Booster


Learn more about
Need a deep-dive on the concept behind this application? Look no further. Learn more about this topic, statistics and related others by exploring similar questions and additional content below.Recommended textbooks for you
College Algebra (MindTap Course List)
Algebra
ISBN:
9781305652231
Author:
R. David Gustafson, Jeff Hughes
Publisher:
Cengage Learning
College Algebra (MindTap Course List)
Algebra
ISBN:
9781305652231
Author:
R. David Gustafson, Jeff Hughes
Publisher:
Cengage Learning