- In a given market the supply curve is based on the following: producers an suppy at a price of 10 up to a quantity of 100. No more than 100 can be applied. Producers will not supply if price is below 10. The demand curve QD=A-20p. . Graph the supply curve and interpret it.. .Now determine A such that the market "just exists" - this the smallest value of A such that an infinitesimal amount will be sold. You can use graphs to help with this; for example, graph the demand curve for a given guess at A and see whether or not the market exists. Determine the range of values of A for which the market "maxes out" and the maximum feasible amount is sold.
- In a given market the supply curve is based on the following: producers an suppy at a price of 10 up to a quantity of 100. No more than 100 can be applied. Producers will not supply if price is below 10. The demand curve QD=A-20p. . Graph the supply curve and interpret it.. .Now determine A such that the market "just exists" - this the smallest value of A such that an infinitesimal amount will be sold. You can use graphs to help with this; for example, graph the demand curve for a given guess at A and see whether or not the market exists. Determine the range of values of A for which the market "maxes out" and the maximum feasible amount is sold.

Chapter5: Markets In Motion And Price Controls
Section: Chapter Questions
Problem 1P

Related questions
Question
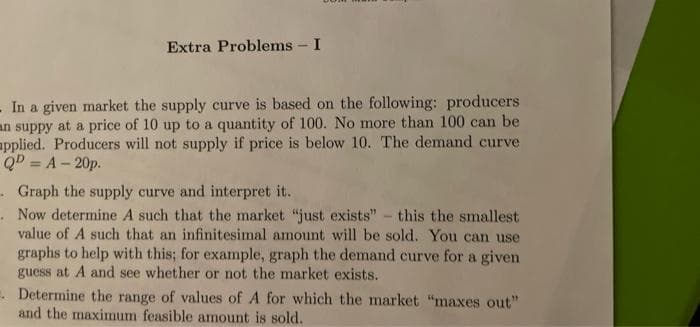
Transcribed Image Text:Extra Problems - I
- In a given market the supply curve is based on the following: producers
an suppy at a price of 10 up to a quantity of 100. No more than 100 can be
applied. Producers will not supply if price is below 10. The demand curve
QD=A-20p.
Graph the supply curve and interpret it.
. Now determine A such that the market "just exists" - this the smallest
value of A such that an infinitesimal amount will be sold. You can use
graphs to help with this; for example, graph the demand curve for a given
guess at A and see whether or not the market exists.
. Determine the range of values of A for which the market "maxes out"
and the maximum feasible amount is sold.
Expert Solution
This question has been solved!
Explore an expertly crafted, step-by-step solution for a thorough understanding of key concepts.

This is a popular solution!

Trending now
This is a popular solution!

Step by step
Solved in 2 steps with 1 images

Knowledge Booster


Learn more about
Need a deep-dive on the concept behind this application? Look no further. Learn more about this topic, economics and related others by exploring similar questions and additional content below.Recommended textbooks for you
Exploring Economics
Economics
ISBN:
9781544336329
Author:
Robert L. Sexton
Publisher:
SAGE Publications, Inc

Essentials of Economics (MindTap Course List)
Economics
ISBN:
9781337091992
Author:
N. Gregory Mankiw
Publisher:
Cengage Learning

Principles of Economics 2e
Economics
ISBN:
9781947172364
Author:
Steven A. Greenlaw; David Shapiro
Publisher:
OpenStax
Exploring Economics
Economics
ISBN:
9781544336329
Author:
Robert L. Sexton
Publisher:
SAGE Publications, Inc
Essentials of Economics (MindTap Course List)
Economics
ISBN:
9781337091992
Author:
N. Gregory Mankiw
Publisher:
Cengage Learning
Principles of Economics 2e
Economics
ISBN:
9781947172364
Author:
Steven A. Greenlaw; David Shapiro
Publisher:
OpenStax

Brief Principles of Macroeconomics (MindTap Cours…
Economics
ISBN:
9781337091985
Author:
N. Gregory Mankiw
Publisher:
Cengage Learning


Economics: Private and Public Choice (MindTap Cou…
Economics
ISBN:
9781305506725
Author:
James D. Gwartney, Richard L. Stroup, Russell S. Sobel, David A. Macpherson
Publisher:
Cengage Learning