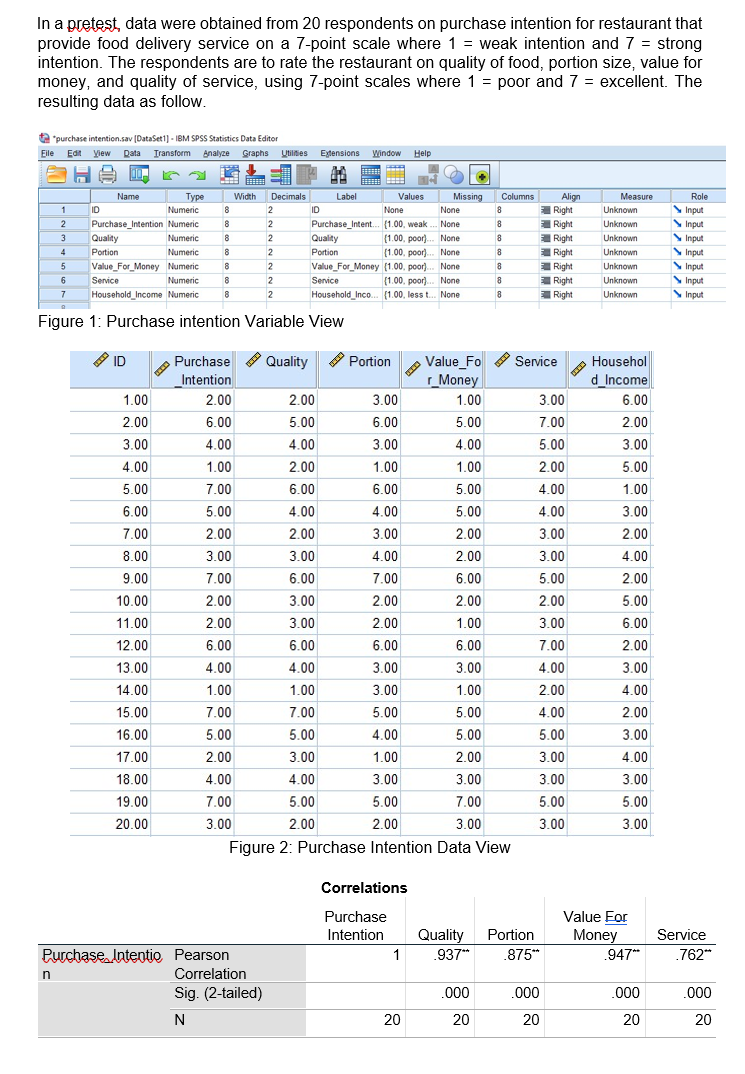
In a pretest, data were obtained from 20 respondents on purchase intention for restaurant that provide food delivery service on a 7-point scale where 1 = weak intention and 7 = strong intention. The respondents are to rate the restaurant on quality of food, portion size, value for money, and quality of service, using 7-point scales where 1 = poor and 7 = excellent. The resulting data as follow. a "purchase intention.sav (Dataset1) - 18M SPSS Statistics Data Editor Ele Edt yew Rata Iransform Analyze Graphs ybides Estensions Window Help Name Туре Width Decimals Label Values Missing Columns Measure Role Align Right ID Numeric ID None None Unknown SInput Purchase_Intention Numeric Quality Portion Value For_Money Numeric Purchase_Intent. (1.00, weak. None (1.00, poor). None (1.00, poor). None Value_For_Money (1.00, poor). None (1.00. poor). None Right SInput SInput Unknown 3 Numeric Quality Portion Right Unknown Numeric 2 Right Unknown Sinput Right | Right Right 2 8 Unknown SInput Senice Numeric 2 Senice 8 Unknown S Input Household_Income Numeric 2 Household_Inco. (1.00, less t. None Unknown SInput Figure 1: Purchase intention Variable View A ID Purchase Quality A Portion Value_Fo Service r_Money Househol Intention d_Income 1.00 2.00 2.00 3.00 1.00 3.00 6.00 2.00 6.00 5.00 6.00 5.00 7.00 2.00 3.00 4.00 4.00 3.00 4.00 5.00 3.00 4.00 1.00 2.00 1.00 1.00 2.00 5.00 5.00 7.00 6.00 6.00 5.00 4.00 1.00 6.00 5.00 4.00 4.00 5.00 4.00 3.00 7.00 2.00 2.00 3.00 2.00 3.00 2.00 8.00 3.00 3.00 4.00 2.00 3.00 4.00 9.00 7.00 6.00 7.00 6.00 5.00 2.00 10.00 2.00 3.00 2.00 2.00 2.00 5.00 11.00 2.00 3.00 2.00 1.00 3.00 6.00 12.00 6.00 6.00 6.00 6.00 7.00 2.00 13.00 4.00 4.00 3.00 3.00 4.00 3.00 14.00 1.00 1.00 3.00 1.00 2.00 4.00 15.00 7.00 7.00 5.00 5.00 4.00 2.00 16.00 5.00 5.00 4.00 5.00 5.00 3.00 17.00 2.00 3.00 1.00 2.00 3.00 4.00 18.00 4.00 4.00 3.00 3.00 3.00 3.00 19.00 7.00 5.00 5.00 7.00 5.00 5.00 20.00 3.00 2.00 2.00 3.00 3.00 3.00 Figure 2: Purchase Intention Data View Correlations Purchase Value Eor Intention 1 Quality Portion 875* .937* Money .947* Service Purchase Intentio Pearson .762* n Correlation Sig. (2-tailed) .000 000 000 .000 N 20 20 20 20 20


Inverse Normal Distribution
The method used for finding the corresponding z-critical value in a normal distribution using the known probability is said to be an inverse normal distribution. The inverse normal distribution is a continuous probability distribution with a family of two parameters.
Mean, Median, Mode
It is a descriptive summary of a data set. It can be defined by using some of the measures. The central tendencies do not provide information regarding individual data from the dataset. However, they give a summary of the data set. The central tendency or measure of central tendency is a central or typical value for a probability distribution.
Z-Scores
A z-score is a unit of measurement used in statistics to describe the position of a raw score in terms of its distance from the mean, measured with reference to standard deviation from the mean. Z-scores are useful in statistics because they allow comparison between two scores that belong to different normal distributions.


Step by step
Solved in 2 steps


