In a statistics class, students took their pulses before and after being frightened. The frightening event was having the teacher scream and run from one side of the room to the other. The pulse rates (beats per minute) of the women before and after the scream were obtained separately and are shown in the accompanying table. Treat this as though it were a random sample of female community college students. Test the hypothesis that the mean of college women's pulse rates is higher after a fright, using a significance level of 0.05. E Click the icon to view the table of pulse rates before and after the scream. Choose a test. Should it be a paired t-test or a two-sample t-test? Why? O A. The test should be a two-sample t-test because the samples are paired. O B. The test should be a paired t-test because the samples are paired. O C. The test should be a paired t-test because the observations are independent. O D. The test should be a two-sample t-test because the observations are independent. Assume that the sample was random and that the distribution of differences is sufficiently Normal. Mention the level of significance. =(Type an integer or a decimal. Do not round.) Step 3: Compute to compare Find the test statistic for this test. t= (Round to two decimal places as needed.) Find the p-value for this test. p-value = (Round to three decimal places as needed.)
In a statistics class, students took their pulses before and after being frightened. The frightening event was having the teacher scream and run from one side of the room to the other. The pulse rates (beats per minute) of the women before and after the scream were obtained separately and are shown in the accompanying table. Treat this as though it were a random sample of female community college students. Test the hypothesis that the mean of college women's pulse rates is higher after a fright, using a significance level of 0.05. E Click the icon to view the table of pulse rates before and after the scream. Choose a test. Should it be a paired t-test or a two-sample t-test? Why? O A. The test should be a two-sample t-test because the samples are paired. O B. The test should be a paired t-test because the samples are paired. O C. The test should be a paired t-test because the observations are independent. O D. The test should be a two-sample t-test because the observations are independent. Assume that the sample was random and that the distribution of differences is sufficiently Normal. Mention the level of significance. =(Type an integer or a decimal. Do not round.) Step 3: Compute to compare Find the test statistic for this test. t= (Round to two decimal places as needed.) Find the p-value for this test. p-value = (Round to three decimal places as needed.)

Glencoe Algebra 1, Student Edition, 9780079039897, 0079039898, 2018
18th Edition
ISBN:9780079039897
Author:Carter
Publisher:Carter
Chapter10: Statistics
Section10.4: Distributions Of Data
Problem 19PFA

Related questions
Topic Video
Question
100%
Transcribed Image Text:i
Data Table
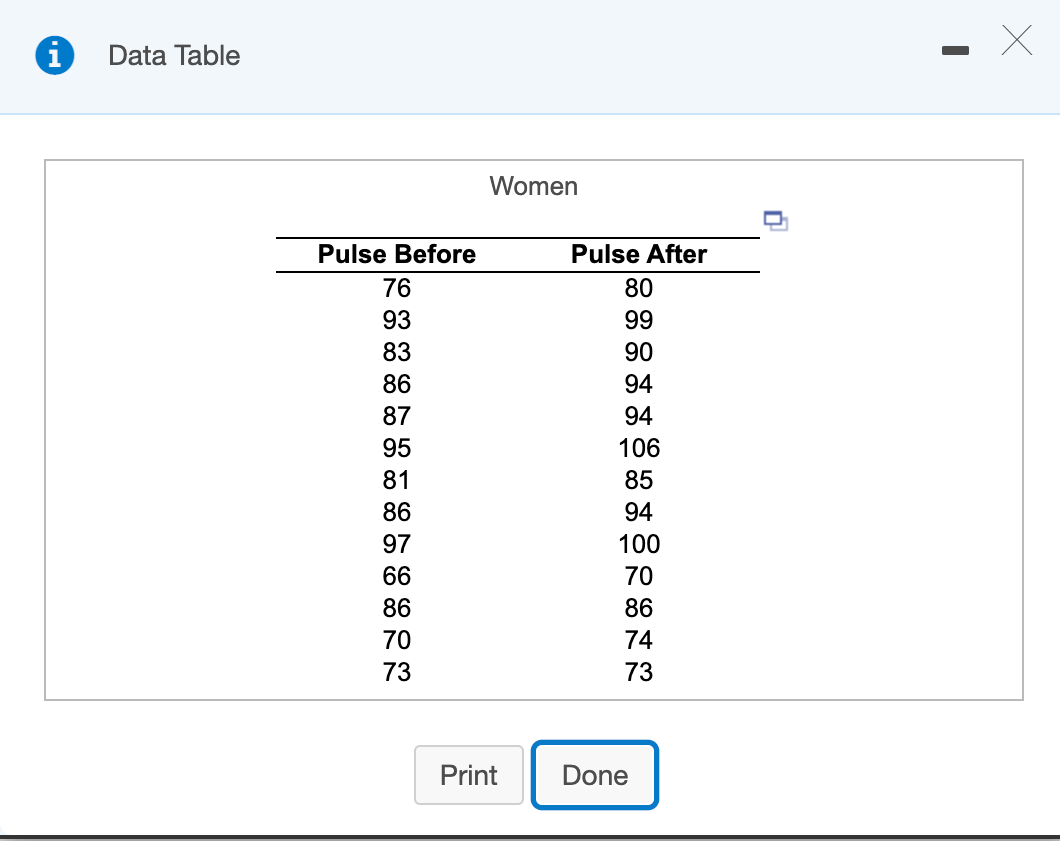
Women
Pulse Before
Pulse After
76
80
93
99
83
90
86
94
87
94
95
106
81
85
86
94
97
100
66
70
86
86
70
74
73
73
Print
Done
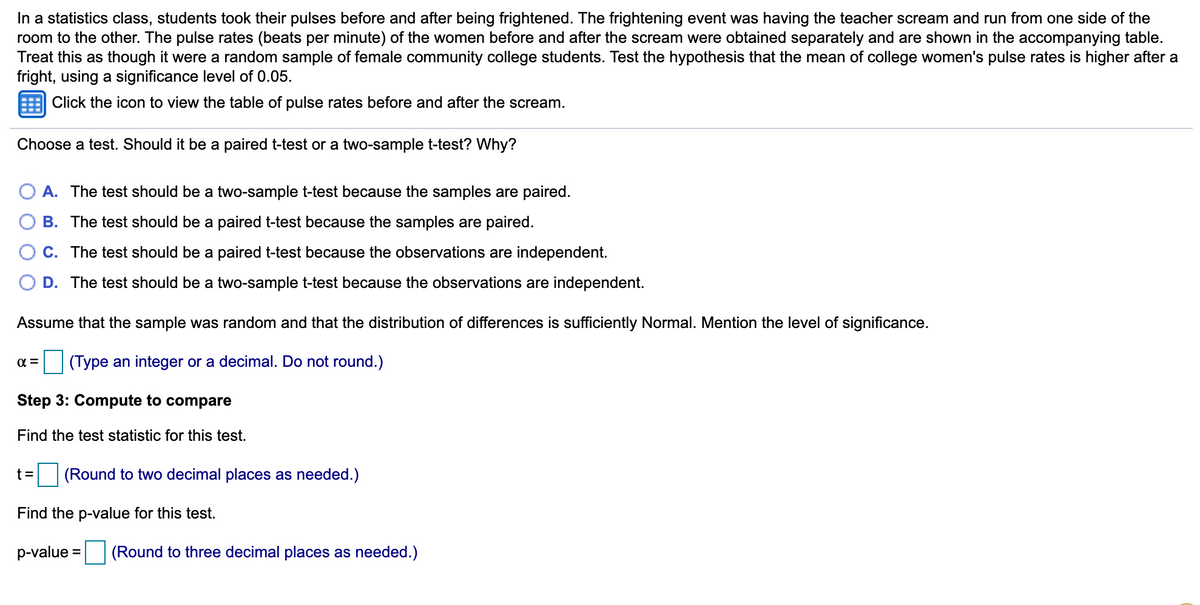
Transcribed Image Text:In a statistics class, students took their pulses before and after being frightened. The frightening event was having the teacher scream and run from one side of the
room to the other. The pulse rates (beats per minute) of the women before and after the scream were obtained separately and are shown in the accompanying table.
Treat this as though it were a random sample of female community college students. Test the hypothesis that the mean of college women's pulse rates is higher after a
fright, using a significance level of 0.05.
Click the icon to view the table of pulse rates before and after the scream.
Choose a test. Should it be a paired t-test or a two-sample t-test? Why?
O A. The test should be a two-sample t-test because the samples are paired.
O B. The test should be a paired t-test because the samples are paired.
C. The test should be a paired t-test because the observations are independent.
D. The test should be a two-sample t-test because the observations are independent.
Assume that the sample was random and that the distribution of differences is sufficiently Normal. Mention the level of significance.
(Type an integer or a decimal. Do not round.)
Step 3: Compute to compare
Find the test statistic for this test.
t =
(Round to two decimal places as needed.)
Find the p-value for this test.
p-value =
(Round to three decimal places as needed.)
Expert Solution
This question has been solved!
Explore an expertly crafted, step-by-step solution for a thorough understanding of key concepts.

This is a popular solution!

Trending now
This is a popular solution!

Step by step
Solved in 4 steps

Knowledge Booster


Learn more about
Need a deep-dive on the concept behind this application? Look no further. Learn more about this topic, statistics and related others by exploring similar questions and additional content below.Recommended textbooks for you
Glencoe Algebra 1, Student Edition, 9780079039897…
Algebra
ISBN:
9780079039897
Author:
Carter
Publisher:
McGraw Hill

Holt Mcdougal Larson Pre-algebra: Student Edition…
Algebra
ISBN:
9780547587776
Author:
HOLT MCDOUGAL
Publisher:
HOLT MCDOUGAL
Glencoe Algebra 1, Student Edition, 9780079039897…
Algebra
ISBN:
9780079039897
Author:
Carter
Publisher:
McGraw Hill
Holt Mcdougal Larson Pre-algebra: Student Edition…
Algebra
ISBN:
9780547587776
Author:
HOLT MCDOUGAL
Publisher:
HOLT MCDOUGAL