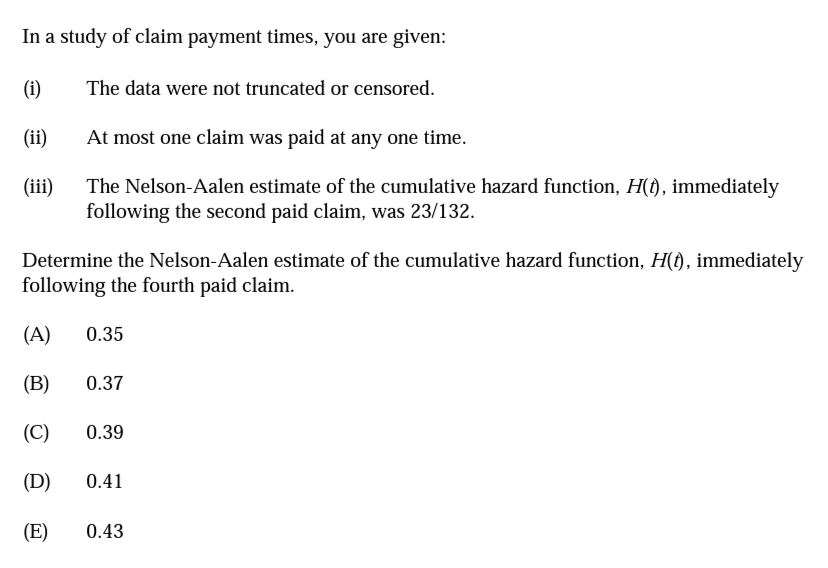
In a study of claim payment times, you are given: (i) The data were not truncated or censored. (ii) At most one claim was paid at any one time. (ii) The Nelson-Aalen estimate of the cumulative hazard function, H(t), immediately following the second paid claim, was 23/132. Determine the Nelson-Aalen estimate of the cumulative hazard function, H(t), immediately following the fourth paid claim. (A) 0.35 (B) 0.37 (C) 0.39 (D) 0.41 (E) 0.43


Q: The program manager wants to forecast conference attendees. Based on the following historical data,…
A: The following information has been given: Year Total Enrollment 1 2950 2 2200 3 2000 4…
Q: With the gasoline time series data from the given table, show the exponential smoothing forecasts…
A:
Q: Consider the following data: Monthly Profit of a Gym: Month & Profit: Jan-12: 5800 Feb-12: 5553…
A: Given the data on the monthly profit of a Gym. The table below shows the required calculation-
Q: Consumption of monthly electric power in million of kwh for street lighting in a big city during…
A:
Q: (a) Make a line chart and fit an m-period moving average to the exchange rate data shown above with…
A: Given, The data set is given. TO find, Make a line chart and fit an m-period moving average to…
Q: 14. Given the following data for demand at the XYZ Company, calculate the monthly forecast using a…
A: The objective is to calculate the forecast error, absolute deviation, mean absolute deviation, bias…
Q: You are also given the following table of :average returns over the last 50 years T-Bills T-Bonds…
A: 1) We are given two means - Arithmetic and Geometric. In this case, since the average is of 50 years…
Q: Part b)| List five situations in which numerical analyses of seepage would be especially useful.
A: Seepage analyses have mainly been executed using the finite element method; numerical analyses using…
Q: Question 2 - The total potential market for a spiral-bound notebook is D = 20,000, and willingness-…
A: Here it is given that , D = 20,000, and willingness-to-pay is distributed uniformly between $0 and…
Q: The article "Simultaneous Optimization of Mechanical Properties of Steel by Maximizing Exponential…
A: Since the p-values of the variables Carbon and Silicon are greater than 0.05. these variables are…
Q: Data collected from the economy of Cardtown reveals that a 16% increase in income leads to the…
A:
Q: Demand Predicted 1 132 113 2 192…
A: CALCULTE MAD:
Q: Age Young Old All ages Population 12,000 13,000 25,000 Columbus, GA No. of deaths from Diabetes 200…
A: Age specific rate explain the measurement for various groups rate. It is calculated by dividing the…
Q: In a study of claim payment times, you are given: (i) The data were not truncated or censored. (ii)…
A:
Q: 5. Consider that in 1915 that the population in the United States was 100 million. Suppose the…
A: Given In 1915, the population size=100 million In 1915, the growth rate=1 million people per year…
Q: The projected annual net cash flows associated with an investment opportunity are shown below in…
A: Given, The projected annual net cash flows associated with an investment opportunity are shown below…
Q: Considering the aggregated demand for coffee beans for the following months shown below, what would…
A: Data is given for 6 months, We have to calculate forcast for 8 th month. We will use 3 months moving…
Q: Consider the following model: yhat = -0.7+-2.1x2 The prediction of y is yhat. What is the estimated…
A:
Q: A shop is planning an order for a popular Christmas festive season product. Demand for the product…
A: From the given information, Consider, Demand = X be a random variable. P (X=x) = p, 0< p<1…
Q: Table 1 HPF Demand in the last 12 periods Period Month Demand in '000 Period Month Demand in…
A: 1. Simple Moving Average with n = 4 Period Month Demand Simple moving average n = 4 Absolute…
Q: The sales records of a major auto manufacturer over the past years from 2005 to 2019 are shown…
A: Develop moving average with k=4 and compute its MSE
Q: Consider the following time series data for the real consumption of households and government, at…
A: Time series defined as the depending on time. The data is arranged in a chronological order of time.…
Q: Considering the aggregated demand for coffee beans for the following months shown below, what would…
A: The following information has been provided: Period (Month) Actual demand 1 455300 2 249422…
Q: Using simple exponential smoothing and the following time series data, respond to each of the items.…
A: Given information: The data presents the values of demand for the period 1 through 10.
Q: The values of Alabama building contracts (in $ millions) for a 12 -month period follow. 240 350…
A: The values of Alabama building contracts (in $ millions) for a 12 -month period are: 240 350 240…
Q: 5 Quarterly data from 1960Q1 to 2009Q4, stored in the file consumptn.dat, were used to estimate the…
A:
Q: An investment of $100 produces rate of return as follows In year 1: a gain of 10 percent In year 2:…
A: The value of the investment The value of the investment at the end of a particular year say t is,…
Q: The Center for Business Analytics is considering a refund policy for no-shows. No refund would be…
A: The center is planning to adopt a refund policy for no-shows. A spreadsheet model needs to be…
Q: (a) Compute E(Y). E(Y) = (b) Suppose an individual with Y violations incurs a surcharge of $110Y2.…
A: Given: y 0 1 2 3 p(y) 0.6 0.25 0.1 0.05
Q: A proposed project has the following cash flow estimates. Assuming independent cash flows, a…
A: (a) Mean of NPV…
Q: Hudson Co. reports the contribution margin income statement for 2019. HUDSON CO. Contribution Margin…
A:
Q: The design life of a planned municipal water-distribution system is to end in 2050, and the…
A: Regression Analysis Regression Analysis helps to estimate the relationship between one…
Q: A shop is planning an order for a popular Christmas festive season product. Demand for the product…
A: From the given information, Consider, Demand = X be a random variable. P (X=x) = p, 0< p<1
Q: QUESTION 1 (continued) c) Calculate the market price of each bond on 23rd April 2021 that issued by…
A: Given data : Time of maturity U.S. Treasury Bond Yield 1 Yr 0.12% 2 Yr 0.14%…
Q: 39- A proposed project has the following cash flow estimates: End of Year Mean Net Cash Flow…
A: Given: The rate of return is 18% that is i=0.18 Concept used: A random variable X can be…
Q: A shop is planning an order for a popular Christmas festive season product. Demand for the product…
A: From the given information, Consider, Demand = X be a random variable. P (X=x) = p, 0< p<1
Q: There is some evidence that, in the years−198185, a simple name change resulted in a short-term…
A: Given mean = 0.82 S.d = 0.13 According to the Chebyshev's theorem at least 100(1-(1/k2))% lies with…
Q: 3. What would be the yearly premium for a $50,000 insurance policy against accidental household…
A: As you have posted multiple questions, we have provided answer for first question only as per our…
Q: Discuss two extensions to the original GARCH (p,q) model and explain additional characteristics of…
A: The two extensions to the original GARCH (p,q) model are Exponential GARCH Explicit multiplicative…
Q: 2. The following data were collected in the study described in Problem 1 relating hypertensive…
A: given Free of Stroke at 5 years…
Q: Question 2: Assume that the risk-free rate, RF, is currently 8%, the market return, RM, is 12%, and…
A: Assume that the risk-free rate, RF, is currently 8%, the market return, RM, is 12%, and asset A has…
Q: Using simple exponential smoothing and the following time series data, respond to each of the items.…
A: Given data: Period Demand 1 104 2 132 3 143 4 137 5 146 6 150 7 101 8 126 9 116…
Q: A proposed project has the following cash flow estimates.Assuming statistically independent cash…
A: a. The mean and standard deviation of net present value: Mean of net present value=∑t=02At1+it Mean…
Q: A) Using the line of best-fit, determine the company’s fixed cost per month and the variable cost…
A: Costs (X) Activity (Y) (x-xbar) (x-xbar)^2 (y-ybar) (y-ybar)^2 (x-xbar)*(y-ybar) 230000 3,500…
Q: Q7.What is the difference between 2019 FYA revenues and LTM revenues (2019 FYA minus LTM)?…
A: From the given data the FYA revenues in 2019 are 2019 FYA=100+250+500+800=1650 And the LTM revenue…
Q: 89 july 223 Feb 57 august 286 mar 144 sept 212 april 221 oct 275 may 177 nov 188 june 280 dec 312 a)…
A: Month Demand Jan 89 Feb 57 mar 144 April 221 may 177 June 280 July 223 august 286…


Trending now
This is a popular solution!

Step by step
Solved in 3 steps with 2 images

- A proposed project has the following cash flow estimates. Assuming independent cash flows, a normally distributed net present value, and a minimum attractive rate of return of 18%, determine the following. For the following questions, employ an analytical solution: a. The mean and standard deviation of net present value. b. The probability that the net present value is positive. c. The probability that the net present value is greater than $5,000. Assume the initial investment and annual receipts are normally distributed. d. Using a Monte Carlo simulation with 10,000 iterations, estimate the probability that the present worth is positive and estimate the probability that the present worth is greater than $5,000.A proposed project has the following cash flow estimates.Assuming statistically independent cash flows, a normally distributed net present value, and a minimum attractive rate of return of 15%, determine the following. For the following questions, employ an analytical solution: a. the mean and standard deviation of net present value. b. the probability that the net present value is negative. c. the probability that the net present value is greater than $1,000,000. Assume the initial investment and annual receipts are normally distributed. d. Using a Monte Carlo simulation with 10,000 iterations, estimate the probability that the present worth is negative.If a fictional treatment costs a total of $45,000 at today’s value and increases a person’s quality of life from 0.5 to 0.6 for the remainder of the person’s life from age 70 onward, and the person’s expected life span increases from 73 to 75, what is the total gain in QALYs (Quality-adjusted Life Years), and what is the ICER (Incremental Cost-effectiveness Ratio)?
- The Boeing Company faces a critical strategic choice in its competition with Airbus Industries for the long-haul flight segment: Should it design and build a super-747 model that can carry 550 passengers at speeds around 350 mph, or a plane that can fly at 95 percent of the speed of sound but carry only about 350 passengers? As a member of Boeing's Planning Group, your task is to build a model to investigate the trade-offs involved in this decision.There is some evidence that, in the years 1981-85, a simple name change resulted in a short-term increase in the price of certain business firms' stocks (relative to the prices of similar stocks). (See D. Horsky and P. Swyngedouw, "Does it pay to change your company's name? A stock market perspective," Marketing Science v.6, pp. 320-35,1987.) Suppose that, to test the profitability of name changes in the more recent market (the past five years), we analyze the stock prices of a large sample of corporations shortly after they changed names, and we find that the mean relative increase in stock price was about 0.87 %, with a standard deviation of 16 %. Suppose that this mean and standard deviation apply to the population of all companies that changed names during the past five years. Complete the following statements about the distribution of relative increases in stock price for all companies that changed names during the past five years. (a) According to Chebyshev's theorem, at least…Compute the forecasted values for Yt for July and August in 2020 by using the modelsstated in (c) and (d)
- In Table 11.2 the estimated coefficient on black is 0.084 in column (1),0.688 in column (2), and 0.389 in column (3). In spite of these large differences, all three models yield similar estimates of the marginal effect of race on the probability of mortgage denial. How can this be?There is some evidence that, in the years−198185, a simple name change resulted in a short-term increase in the price of certain business firms' stocks (relative to the prices of similar stocks). (See D. Horsky and P. Swyngedouw, "Does it pay to change your company's name? A stock market perspective," Marketing Sciencev. 6, pp.−32035,1987.) Suppose that, to test the profitability of name changes in the more recent market (the past five years), we analyze the stock prices of a large sample of corporations shortly after they changed names, and we find that the mean relative increase in stock price was about 0.82%, with a standard deviation of 0.13%. Suppose that this mean and standard deviation apply to the population of all companies that changed names during the past five years. Complete the following statements about the distribution of relative increases in stock price for all companies that changed names during the past five years. a) According to Chebyshev's theorem, at least 56%…There is some evidence that, in the years−198185, a simple name change resulted in a short-term increase in the price of certain business firms' stocks (relative to the prices of similar stocks). (See D. Horsky and P. Swyngedouw, "Does it pay to change your company's name? A stock market perspective," Marketing Science v. 6, pp.−32035,1987.) Suppose that, to test the profitability of name changes in the more recent market (the past five years), we analyze the stock prices of a large sample of corporations shortly after they changed names, and we find that the mean relative increase in stock price was about 0.86 %, with a standard deviation of 0.10%. Suppose that this mean and standard deviation apply to the population of all companies that changed names during the past five years. Complete the following statements about the distribution of relative increases in stock price for all companies that changed names during the past five years. According to Chebyshev's theorem, at least 84%…
- There is some evidence that, in the years −198185 , a simple name change resulted in a short-term increase in the price of certain business firms' stocks (relative to the prices of similar stocks). (See D. Horsky and P. Swyngedouw, "Does it pay to change your company's name? A stock market perspective," Marketing Science v. 6 , pp. −32035,1987 .) Suppose that, to test the profitability of name changes in the more recent market (the past five years), we analyze the stock prices of a large sample of corporations shortly after they changed names, and we find that the mean relative increase in stock price was about 0.89 %, with a standard deviation of 0.16 %. Suppose that this mean and standard deviation apply to the population of all companies that changed names during the past five years. Complete the following statements about the distribution of relative increases in stock price for all companies that changed names during the past five years. (a)…a) Genenesis Dispensary is contemplating of opening a new branch in Mwanza. If the medical for medical service is favourable, Genesis could realize a net profit of Tsh.100 million. On the other hand, if the market turn out to be unfavourable, it can end up losing Tsh. 40 million. Of course, Genesis may opt not to persue this option of expanding its operations. In the absence of data from which to base its decision, te best guess for Gensis is equally likely that the dispensary will either be successful or unsuccessful Required: i) Use the decison tree approach, what decison should Genesis Dispensary take b) Market research firm named, Easy Market Access approach Genesis with an offer to undertake a study of Mwanza medical service market at a fee of Tsh. 5 million. Easy Market Access claims that their experience enables them to use Bayes’ Theoremn to make the following statements about different state of the market: ▪ Provide that the study is favourable, the probability of favourable…Recent publications have addressed the growing concern in the scientific community around the increased prevalence of CAT scans in children between the ages of 7-18 and the growing rate of childhood cancers. Suppose the researcher plans to gather a SRS from a group of children in this age range who have received one or more CAT scans, and a SRS from a group of children who have never received a CAT scan and compare the number of cases of childhood cancers that develop over a prolonged period of time. Assume the following table summarizes the descriptive statistics for his samples. Population Average cases of childhood cancers Standard deviaton Sample size >CAT scan 24.6 2.4 1,894 No CAT scans 11.4 1.9 2,745 A) Carry out the appropriate statistical test to answer the researcher’s hypothesis regarding the difference in average cases of childhood cancers in children aged 7-18 receiving one or more CAT scans versus those that have never received a CAT scan. Use an alpha level…
