In a study to determine the relationship between ambient outdoor temperature and the rate of evaporation of water from soil, measurements of average daytime temperature in °C and evaporation in mm/day were taken for 40 days. The results are shown in the following table. Temp. Evap. 11.8 2.4 21.5 4.4 16.5 5.0 23.6 4.1 6.0 19.1 21.6 5.9 31.0 4.8 18.9 3.0 24.2 7.1 19.1 1.6 11.8 3.8 24.2 5.0 15.8 2.6 26.8 8.0 24.8 5.4 26.2 4.2 14.2 14.1 4.4 2.2 30.3 5.7 15.2 1.2 18.6 3.5 25.4 5.5 22.1 4.8 25.4 4.8 22.6 3.2 24.4 5.1 15.8 3.3 22.3 4.9 23.2 7.4 19.7 3.3 14.0 1.1 13.6 3.5 25.4 5.1 17.7 2.0 24.7 5.7 24.3 4.7 25.8 5.8 28.3 5.8 29.8 7.8 26.5 5.1 Compute the least-squares line for predicting evaporation (y) from temperature (x). b. Compute 95% confidence intervals for Bo and B1. a. Predict the evaporation rate when the temperature is 20°C. Find a 95% confidence interval for the mean evaporation rate for all days with a temperature of 20°C. Find a 95% prediction interval for the evaporation rate on a given day with a temperature of 20°C. C. d. e.
In a study to determine the relationship between ambient outdoor temperature and the rate of evaporation of water from soil, measurements of average daytime temperature in °C and evaporation in mm/day were taken for 40 days. The results are shown in the following table. Temp. Evap. 11.8 2.4 21.5 4.4 16.5 5.0 23.6 4.1 6.0 19.1 21.6 5.9 31.0 4.8 18.9 3.0 24.2 7.1 19.1 1.6 11.8 3.8 24.2 5.0 15.8 2.6 26.8 8.0 24.8 5.4 26.2 4.2 14.2 14.1 4.4 2.2 30.3 5.7 15.2 1.2 18.6 3.5 25.4 5.5 22.1 4.8 25.4 4.8 22.6 3.2 24.4 5.1 15.8 3.3 22.3 4.9 23.2 7.4 19.7 3.3 14.0 1.1 13.6 3.5 25.4 5.1 17.7 2.0 24.7 5.7 24.3 4.7 25.8 5.8 28.3 5.8 29.8 7.8 26.5 5.1 Compute the least-squares line for predicting evaporation (y) from temperature (x). b. Compute 95% confidence intervals for Bo and B1. a. Predict the evaporation rate when the temperature is 20°C. Find a 95% confidence interval for the mean evaporation rate for all days with a temperature of 20°C. Find a 95% prediction interval for the evaporation rate on a given day with a temperature of 20°C. C. d. e.

Glencoe Algebra 1, Student Edition, 9780079039897, 0079039898, 2018
18th Edition
ISBN:9780079039897
Author:Carter
Publisher:Carter
Chapter10: Statistics
Section10.6: Summarizing Categorical Data
Problem 31PPS

Related questions
Question
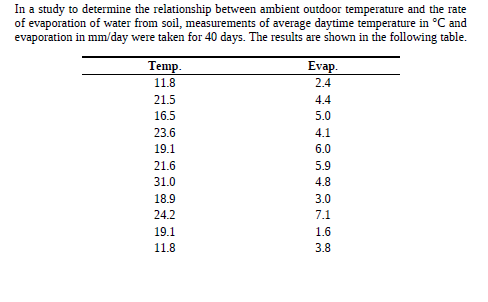
Transcribed Image Text:In a study to determine the relationship between ambient outdoor temperature and the rate
of evaporation of water from soil, measurements of average daytime temperature in °C and
evaporation in mm/day were taken for 40 days. The results are shown in the following table.
Temp.
Evap.
11.8
2.4
21.5
4.4
16.5
5.0
23.6
4.1
6.0
19.1
21.6
5.9
31.0
4.8
18.9
3.0
24.2
7.1
19.1
1.6
11.8
3.8
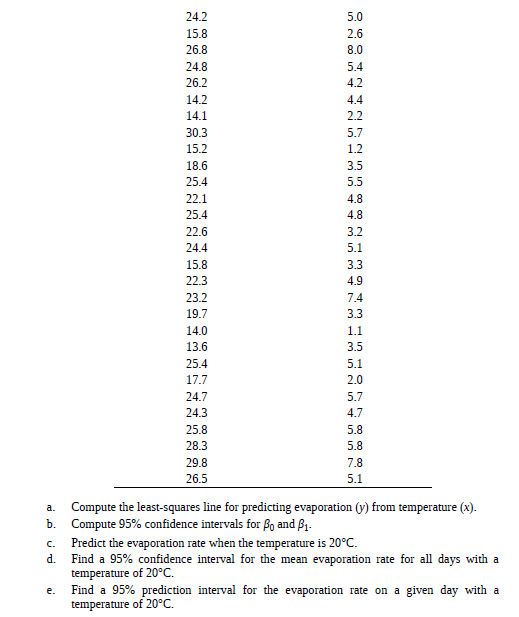
Transcribed Image Text:24.2
5.0
15.8
2.6
26.8
8.0
24.8
5.4
26.2
4.2
14.2
14.1
4.4
2.2
30.3
5.7
15.2
1.2
18.6
3.5
25.4
5.5
22.1
4.8
25.4
4.8
22.6
3.2
24.4
5.1
15.8
3.3
22.3
4.9
23.2
7.4
19.7
3.3
14.0
1.1
13.6
3.5
25.4
5.1
17.7
2.0
24.7
5.7
24.3
4.7
25.8
5.8
28.3
5.8
29.8
7.8
26.5
5.1
Compute the least-squares line for predicting evaporation (y) from temperature (x).
b. Compute 95% confidence intervals for Bo and B1.
a.
Predict the evaporation rate when the temperature is 20°C.
Find a 95% confidence interval for the mean evaporation rate for all days with a
temperature of 20°C.
Find a 95% prediction interval for the evaporation rate on a given day with a
temperature of 20°C.
C.
d.
e.
Expert Solution
This question has been solved!
Explore an expertly crafted, step-by-step solution for a thorough understanding of key concepts.

This is a popular solution!

Trending now
This is a popular solution!

Step by step
Solved in 2 steps with 3 images

Recommended textbooks for you
Glencoe Algebra 1, Student Edition, 9780079039897…
Algebra
ISBN:
9780079039897
Author:
Carter
Publisher:
McGraw Hill
Glencoe Algebra 1, Student Edition, 9780079039897…
Algebra
ISBN:
9780079039897
Author:
Carter
Publisher:
McGraw Hill