In biofiltration of wastewater, air discharged from a treatment facility is passed through a damp porous membrane that causes contaminants to dissolve in water and be transformed into harmless products. Air discharge usually contains hydrogen sulfide, organic sulfides, and other volatile organic compounds (VOCS). For this experiment, it is desired to investigate the relationship between air inlet temperature and removal efficiency of porous membrane. The accompanying data on x = inlet temperature (°C) and y = removal efficiency (%) is shown below. Removal Removal Observation Temp Observation Temp % 1 7.68 98.09 17 8.55 98.27 6.51 98.25 18 7.59 98 6.49 97.82 19 6.94 98.09 5.48 97.82 20 8.31 98.25 6.57 97.82 21 10.5 98.41 6. 10.13 97.93 22 16.02 98.51 15.71 98.38 23 17.83 98.71 8. 16.77 98.89 24 17.03 98.79 9. 17.13 98.96 25 16.18 98.87 10 17.63 98.9 26 16.31 98.76 11 16.72 98.68 27 14.44 98.58 12 15.45 98.69 28 12.78 98.73 13 12.21 98.51 29 12.25 98.45 14 11.44 98.09 30 11.64 98.37 15 10.17 98.25 31 11.34 98.36 16 9.64 98.36 32 10.97 98.45 Using the data in Experiment 1, determine if there is sufficient evidence that inlet temperature could improve the removal efficiency of the membrane. a. How does the inlet temperature affect the removal rate? b. How strong is the relationship you concluded in 1a? c. How significant is the relationship in 1a? d. To a certain degree, can you estimate the expected removal rate with inlet temperature? Demonstrate this using an example. What is the typical deviation from the estimate? e. Using residual analysis, verify that your conclusion in 1a-1c and your estimate in 1d are valid. f. support your residual analysis in le by checking the normality of the errors in estimates.
In biofiltration of wastewater, air discharged from a treatment facility is passed through a damp porous membrane that causes contaminants to dissolve in water and be transformed into harmless products. Air discharge usually contains hydrogen sulfide, organic sulfides, and other volatile organic compounds (VOCS). For this experiment, it is desired to investigate the relationship between air inlet temperature and removal efficiency of porous membrane. The accompanying data on x = inlet temperature (°C) and y = removal efficiency (%) is shown below. Removal Removal Observation Temp Observation Temp % 1 7.68 98.09 17 8.55 98.27 6.51 98.25 18 7.59 98 6.49 97.82 19 6.94 98.09 5.48 97.82 20 8.31 98.25 6.57 97.82 21 10.5 98.41 6. 10.13 97.93 22 16.02 98.51 15.71 98.38 23 17.83 98.71 8. 16.77 98.89 24 17.03 98.79 9. 17.13 98.96 25 16.18 98.87 10 17.63 98.9 26 16.31 98.76 11 16.72 98.68 27 14.44 98.58 12 15.45 98.69 28 12.78 98.73 13 12.21 98.51 29 12.25 98.45 14 11.44 98.09 30 11.64 98.37 15 10.17 98.25 31 11.34 98.36 16 9.64 98.36 32 10.97 98.45 Using the data in Experiment 1, determine if there is sufficient evidence that inlet temperature could improve the removal efficiency of the membrane. a. How does the inlet temperature affect the removal rate? b. How strong is the relationship you concluded in 1a? c. How significant is the relationship in 1a? d. To a certain degree, can you estimate the expected removal rate with inlet temperature? Demonstrate this using an example. What is the typical deviation from the estimate? e. Using residual analysis, verify that your conclusion in 1a-1c and your estimate in 1d are valid. f. support your residual analysis in le by checking the normality of the errors in estimates.

Glencoe Algebra 1, Student Edition, 9780079039897, 0079039898, 2018
18th Edition
ISBN:9780079039897
Author:Carter
Publisher:Carter
Chapter10: Statistics
Section10.6: Summarizing Categorical Data
Problem 31PPS

Related questions
Question
Hello! I need answer for letter F only using Kolmogorov- Smirnov test to support the residual analysis (provided on the second picture).
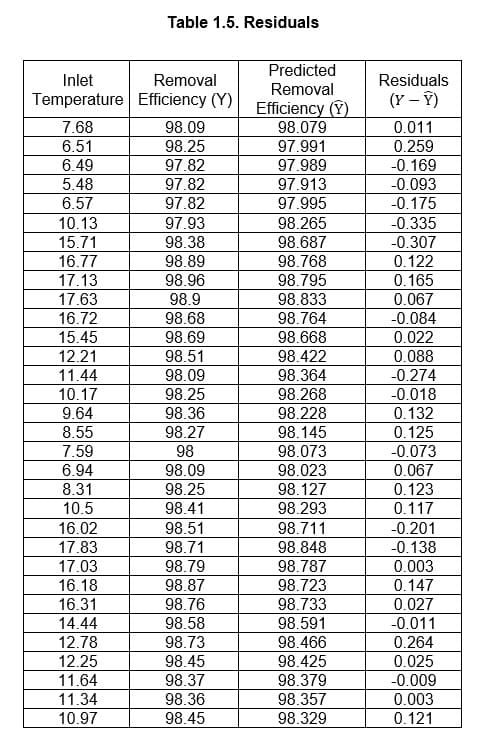
Transcribed Image Text:Table 1.5. Residuals
Predicted
Inlet
Removal
Residuals
Removal
Temperature Efficiency (Y)
(Y – Ý)
Efficiency (Y)
98.09
98.25
7.68
98.079
0.011
6.51
97.991
0.259
6.49
97.82
97.989
-0.169
5.48
97.82
97.82
97.913
97.995
-0.093
6.57
-0.175
10.13
97.93
98.265
-0.335
15.71
98.38
98.687
-0.307
0.122
0.165
16.77
98.89
98.768
17.13
17.63
16.72
98.96
98.795
98.9
98.833
0.067
98.68
98.69
98.764
-0.084
15.45
98.668
0.022
12.21
98.51
98.422
0.088
11.44
10.17
98.09
98.364
98.268
-0.274
98.25
-0.018
98.36
9.64
8.55
98.228
0.132
98.27
98.145
0.125
7.59
98
98.073
98.023
-0.073
6.94
98.09
0.067
8.31
98.25
98.127
0.123
10.5
98.41
98.293
0.117
16.02
98.51
98.711
-0.201
17.83
17.03
98.71
98.848
-0.138
98.79
98.787
0.003
16.18
98.87
98.723
0.147
16.31
98.76
98.733
0.027
14.44
98.58
98.591
-0.011
12.78
98.73
98.45
98.466
0.264
0.025
12.25
98.425
11.64
98.37
98.379
-0.009
11.34
98.36
98.357
0.003
10.97
98.45
98.329
0.121
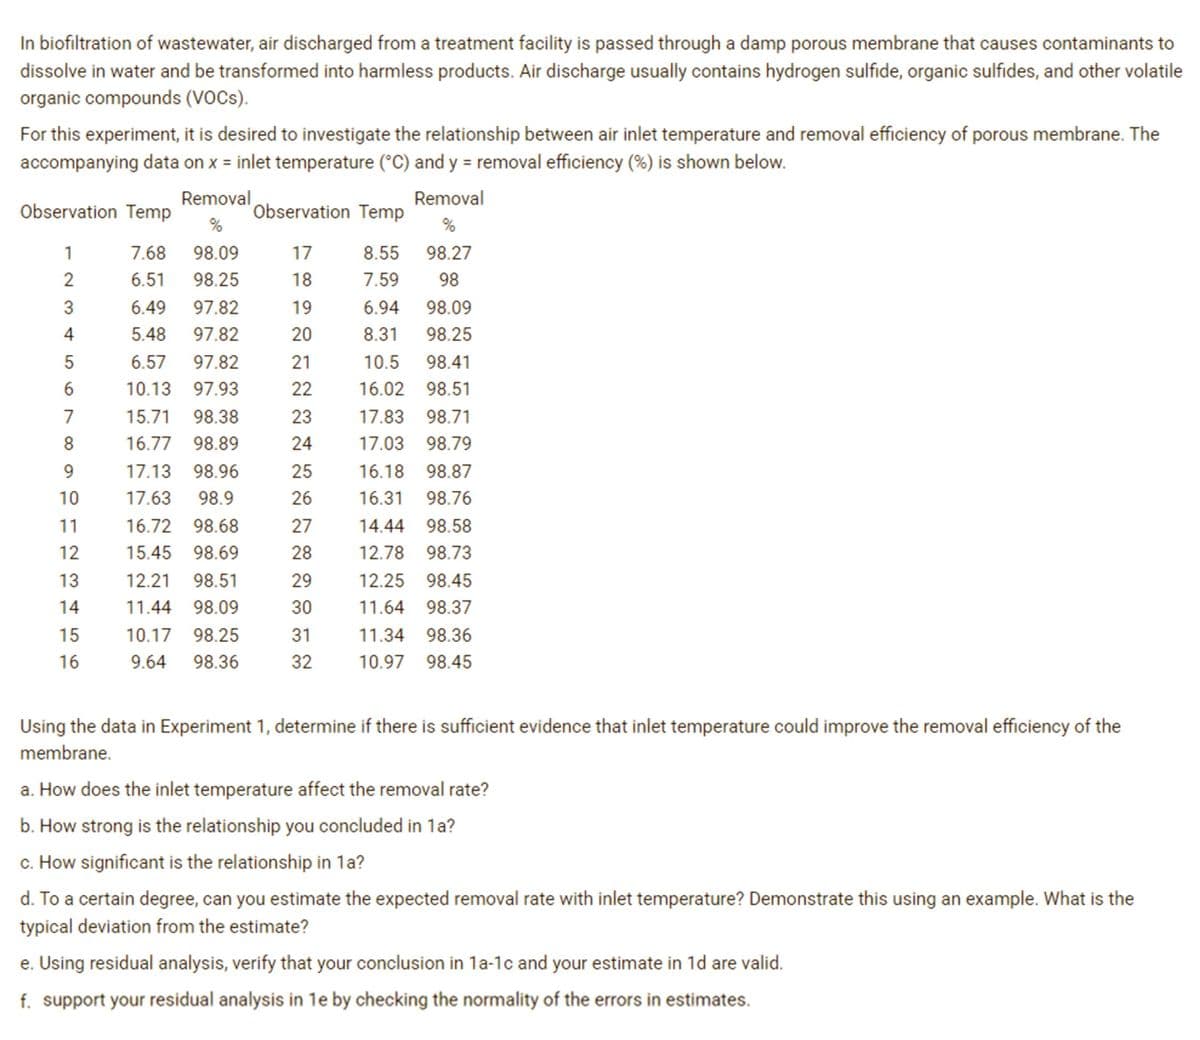
Transcribed Image Text:In biofiltration of wastewater, air discharged from a treatment facility is passed through a damp porous membrane that causes contaminants to
dissolve in water and be transformed into harmless products. Air discharge usually contains hydrogen sulfide, organic sulfides, and other volatile
organic compounds (VOCS).
For this experiment, it is desired to investigate the relationship between air inlet temperature and removal efficiency of porous membrane. The
accompanying data on x = inlet temperature (°C) and y = removal efficiency (%) is shown below.
Removal
Removal
Observation Temp
Observation Temp
%
%
1
7.68
98.09
17
8.55
98.27
6.51
98.25
18
7.59
98
3
6.49
97.82
19
6.94
98.09
4
5.48
97.82
20
8.31
98.25
5
6.57
97.82
21
10.5
98.41
10.13
97.93
22
16.02 98.51
7
15.71
98.38
23
17.83 98.71
8
16.77 98.89
24
17.03 98.79
9.
17.13
98.96
25
16.18 98.87
10
17.63
98.9
26
16.31
98.76
11
16.72 98.68
27
14.44 98.58
12
15.45 98.69
28
12.78 98.73
13
12.21
98.51
29
12.25 98.45
14
11.44 98.09
30
11.64 98.37
15
10.17
98.25
31
11.34 98.36
16
9.64
98.36
32
10.97 98.45
Using the data in Experiment 1, determine if there is sufficient evidence that inlet temperature could improve the removal efficiency of the
membrane.
a. How does the inlet temperature affect the removal rate?
b. How strong is the relationship you concluded in 1a?
c. How significant is the relationship in 1a?
d. To a certain degree, can you estimate the expected removal rate with inlet temperature? Demonstrate this using an example. What is the
typical deviation from the estimate?
e. Using residual analysis, verify that your conclusion in 1a-1c and your estimate in 1d are valid.
f. support your residual analysis in 1e by checking the normality of the errors in estimates.
Expert Solution
This question has been solved!
Explore an expertly crafted, step-by-step solution for a thorough understanding of key concepts.

This is a popular solution!

Trending now
This is a popular solution!

Step by step
Solved in 3 steps

Recommended textbooks for you
Glencoe Algebra 1, Student Edition, 9780079039897…
Algebra
ISBN:
9780079039897
Author:
Carter
Publisher:
McGraw Hill

Glencoe Algebra 1, Student Edition, 9780079039897…
Algebra
ISBN:
9780079039897
Author:
Carter
Publisher:
McGraw Hill