In biofiltration of wastewater, air discharged from a treatment facility is passed through a damp porous membrane that causes contaminants to dissolve in water and be transformed into harmless products. Air discharge usually contains hydrogen sulfide, organic sulfides, and other volatile organic compounds (VOCS). For this experiment, it is desired to investigate the relationship between air inlet temperature and removal efficiency of porous membrane. The accompanying data on x = inlet temperature (°C) and y removal efficiency (%) is shown below. Removal Removal Observation Temp Observation Temp % % 1 7.68 98.09 17 8.55 98.27 6.51 98.25 18 7.59 98 6.49 97.82 19 6.94 98.09 4 5.48 97.82 20 8.31 98.25 6.57 97.82 21 10.5 98.41 10.13 97.93 22 16.02 98.51 15.71 98.38 23 17.83 98.71 16.77 98.89 24 17.03 98.79 17.13 98.96 25 16.18 98.87 10 17.63 98.9 26 16.31 98.76 11 16.72 98.68 27 14.44 98.58 12 15.45 98.69 28 12.78 98.73 13 12.21 98.51 29 12.25 98.45 14 11.44 98.09 30 11.64 98.37 15 10.17 98.25 31 11.34 98.36 16 9.64 98.36 32 10.97 98.45 Using the data in Experiment 1, determine if there is sufficient evidence that inlet temperature could improve the removal efficiency of the membrane. a. How does the inlet temperature affect the removal rate? b. How strong is the relationship you concluded in 1a? c. How significant is the relationship in 1a? d. To a certain degree, can you estimate the expected removal rate with inlet temperature? Demonstrate this using an example. What is the typical deviation from the estimate? e. Using residual analysis, verify that your conclusion in 1a-1c and your estimate in 1d are valid. f. support your residual analysis in 1e by checking the normality of the errors in estimates. 567 o
In biofiltration of wastewater, air discharged from a treatment facility is passed through a damp porous membrane that causes contaminants to dissolve in water and be transformed into harmless products. Air discharge usually contains hydrogen sulfide, organic sulfides, and other volatile organic compounds (VOCS). For this experiment, it is desired to investigate the relationship between air inlet temperature and removal efficiency of porous membrane. The accompanying data on x = inlet temperature (°C) and y removal efficiency (%) is shown below. Removal Removal Observation Temp Observation Temp % % 1 7.68 98.09 17 8.55 98.27 6.51 98.25 18 7.59 98 6.49 97.82 19 6.94 98.09 4 5.48 97.82 20 8.31 98.25 6.57 97.82 21 10.5 98.41 10.13 97.93 22 16.02 98.51 15.71 98.38 23 17.83 98.71 16.77 98.89 24 17.03 98.79 17.13 98.96 25 16.18 98.87 10 17.63 98.9 26 16.31 98.76 11 16.72 98.68 27 14.44 98.58 12 15.45 98.69 28 12.78 98.73 13 12.21 98.51 29 12.25 98.45 14 11.44 98.09 30 11.64 98.37 15 10.17 98.25 31 11.34 98.36 16 9.64 98.36 32 10.97 98.45 Using the data in Experiment 1, determine if there is sufficient evidence that inlet temperature could improve the removal efficiency of the membrane. a. How does the inlet temperature affect the removal rate? b. How strong is the relationship you concluded in 1a? c. How significant is the relationship in 1a? d. To a certain degree, can you estimate the expected removal rate with inlet temperature? Demonstrate this using an example. What is the typical deviation from the estimate? e. Using residual analysis, verify that your conclusion in 1a-1c and your estimate in 1d are valid. f. support your residual analysis in 1e by checking the normality of the errors in estimates. 567 o

MATLAB: An Introduction with Applications
6th Edition
ISBN:9781119256830
Author:Amos Gilat
Publisher:Amos Gilat
Chapter1: Starting With Matlab
Section: Chapter Questions
Problem 1P

Related questions
Question
Please help me with letter B
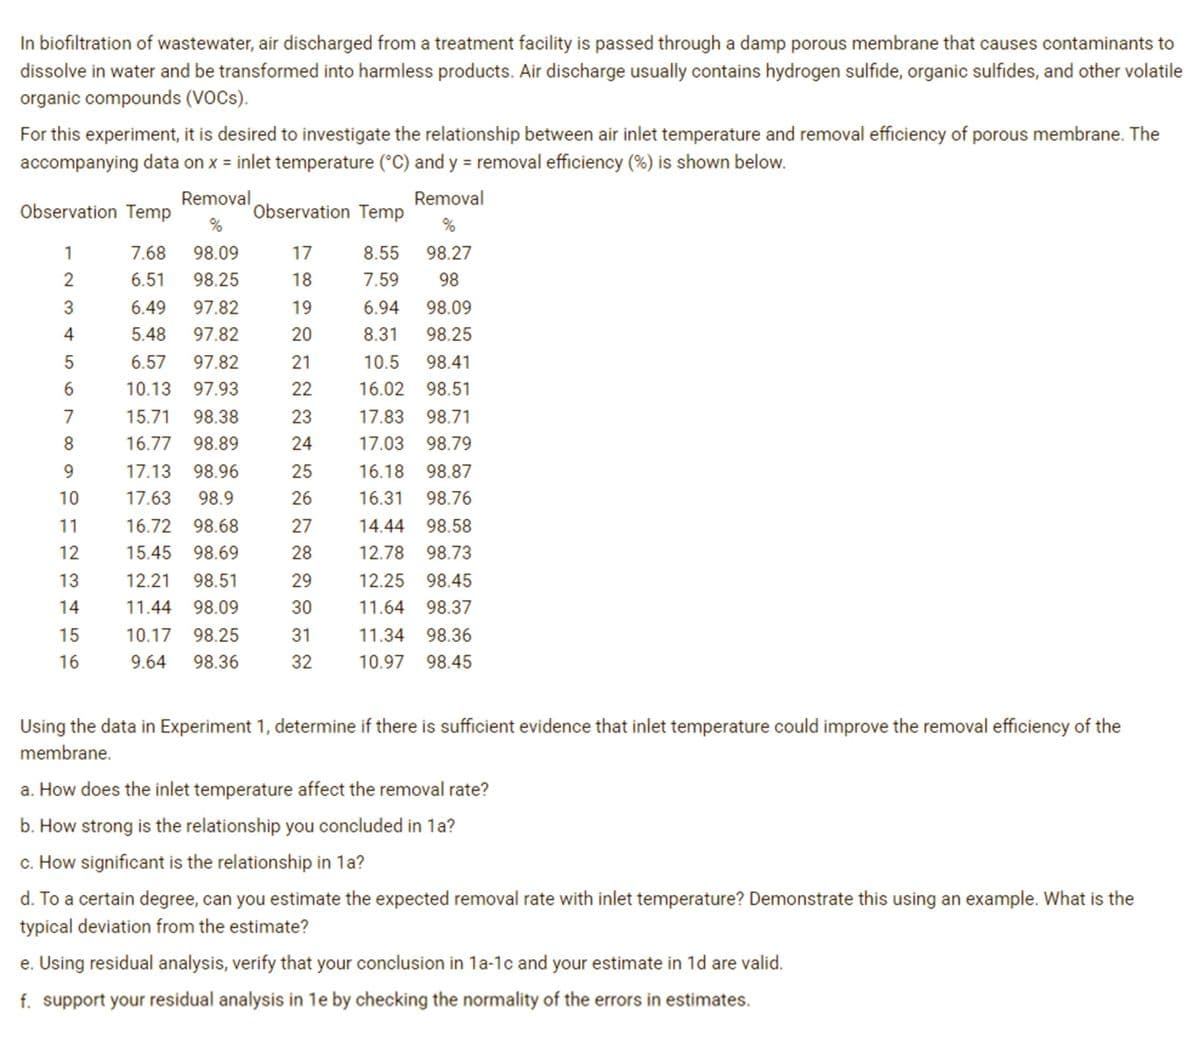
Transcribed Image Text:In biofiltration of wastewater, air discharged from a treatment facility is passed through a damp porous membrane that causes contaminants to
dissolve in water and be transformed into harmless products. Air discharge usually contains hydrogen sulfide, organic sulfides, and other volatile
organic compounds (VOCS).
For this experiment, it is desired to investigate the relationship between air inlet temperature and removal efficiency of porous membrane. The
accompanying data on x = inlet temperature (°C) and y = removal efficiency (%) is shown below.
Removal
Removal
Observation Temp
Observation Temp
%
1
7.68
98.09
17
8.55
98.27
2
6.51
98.25
18
7.59
98
6.49
97.82
19
6.94
98.09
5.48
97.82
20
8.31
98.25
6.57
97.82
21
10.5
98.41
10.13 97.93
22
16.02
98.51
7
15.71
98.38
23
17.83
98.71
16.77
98.89
24
17.03
98.79
9.
17.13
98.96
25
16.18
98.87
10
17.63
98.9
26
16.31
98.76
11
16.72 98.68
27
14.44
98.58
12
15.45
98.69
28
12.78
98.73
13
12.21
98.51
29
12.25
98.45
14
11.44
98.09
30
11.64
98.37
15
10.17
98.25
31
11.34
98.36
16
9.64
98.36
32
10.97
98.45
Using the data in Experiment 1, determine if there is sufficient evidence that inlet temperature could improve the removal efficiency of the
membrane.
a. How does the inlet temperature affect the removal rate?
b. How strong is the relationship you concluded in 1a?
c. How significant is the relationship in 1a?
d. To a certain degree, can you estimate the expected removal rate with inlet temperature? Demonstrate this using an example. What is the
typical deviation from the estimate?
e. Using residual analysis, verify that your conclusion in 1a-1c and your estimate in 1d are valid.
f. support your residual analysis in 1e by checking the normality of the errors in estimates.
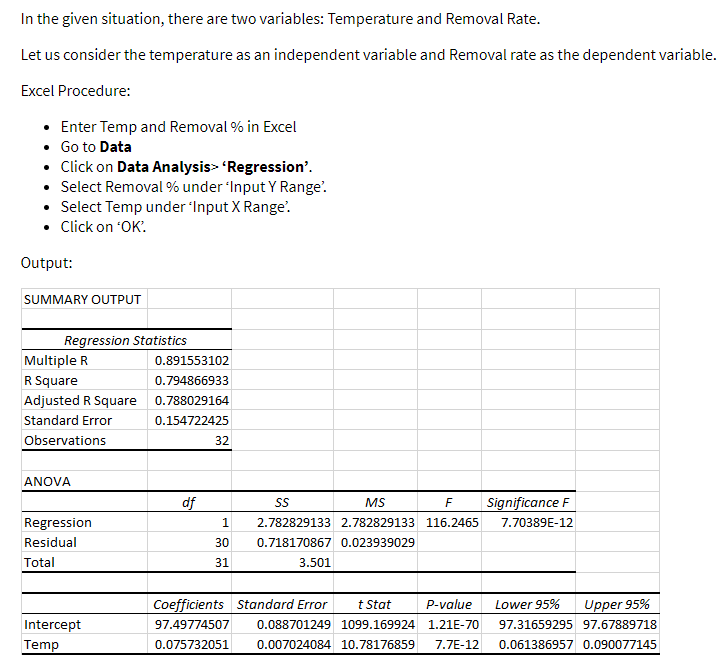
Transcribed Image Text:In the given situation, there are two variables: Temperature and Removal Rate.
Let us consider the temperature as an independent variable and Removal rate as the dependent variable.
Excel Procedure:
• Enter Temp and Removal % in Excel
• Go to Data
• Cick on Data Analysis> 'Regression'.
• Select Removal % under 'Input Y Range'.
• Select Temp under 'Input X Range'.
• Cick on 'OK.
Output:
SUMMARY OUTPUT
Regression Statistics
Multiple R
0.891553102
R Square
0.794866933
Adjusted R Square
0.788029164
Standard Error
0.154722425
Observations
32
ANOVA
df
Significance F
SS
MS
Regression
1
2.782829133 2.782829133 116.2465
7.70389E-12
Residual
30
0.718170867 0.023939029
Total
31
3.501
Coefficients Standard Error
t Stat
P-value
Lower 95%
Upper 95%
Intercept
97.49774507
0.088701249 1099.169924 1.21E-70
97.31659295 97.67889718
Temp
0.075732051
0.007024084 10.78176859
7.7E-12
0.061386957 0.090077145
Expert Solution
This question has been solved!
Explore an expertly crafted, step-by-step solution for a thorough understanding of key concepts.

Step by step
Solved in 2 steps with 1 images

Recommended textbooks for you
MATLAB: An Introduction with Applications
Statistics
ISBN:
9781119256830
Author:
Amos Gilat
Publisher:
John Wiley & Sons Inc

Probability and Statistics for Engineering and th…
Statistics
ISBN:
9781305251809
Author:
Jay L. Devore
Publisher:
Cengage Learning

Statistics for The Behavioral Sciences (MindTap C…
Statistics
ISBN:
9781305504912
Author:
Frederick J Gravetter, Larry B. Wallnau
Publisher:
Cengage Learning
MATLAB: An Introduction with Applications
Statistics
ISBN:
9781119256830
Author:
Amos Gilat
Publisher:
John Wiley & Sons Inc
Probability and Statistics for Engineering and th…
Statistics
ISBN:
9781305251809
Author:
Jay L. Devore
Publisher:
Cengage Learning
Statistics for The Behavioral Sciences (MindTap C…
Statistics
ISBN:
9781305504912
Author:
Frederick J Gravetter, Larry B. Wallnau
Publisher:
Cengage Learning

Elementary Statistics: Picturing the World (7th E…
Statistics
ISBN:
9780134683416
Author:
Ron Larson, Betsy Farber
Publisher:
PEARSON

The Basic Practice of Statistics
Statistics
ISBN:
9781319042578
Author:
David S. Moore, William I. Notz, Michael A. Fligner
Publisher:
W. H. Freeman

Introduction to the Practice of Statistics
Statistics
ISBN:
9781319013387
Author:
David S. Moore, George P. McCabe, Bruce A. Craig
Publisher:
W. H. Freeman