In Chicago, 120 people are willing to work an hour as hostesses if the wage is $20 per hour. For each additional $5 that the wage rises above $20, an additional 30 people are willing to work an hour. For wages of $20, $25, $30, $35, and $40 per hour, plot the daily labor supply curve for hostesses on the following graph. 50 45 Supply 40 35 30 25 20 15 10 5 30 60 90 120 150 180 210 240 270 300 LABOR (Number of workers) WAGE (Dollars per hour)
In Chicago, 120 people are willing to work an hour as hostesses if the wage is $20 per hour. For each additional $5 that the wage rises above $20, an additional 30 people are willing to work an hour. For wages of $20, $25, $30, $35, and $40 per hour, plot the daily labor supply curve for hostesses on the following graph. 50 45 Supply 40 35 30 25 20 15 10 5 30 60 90 120 150 180 210 240 270 300 LABOR (Number of workers) WAGE (Dollars per hour)

Chapter12: Labor Markets And Labor Unions
Section: Chapter Questions
Problem 1.1P

Related questions
Question
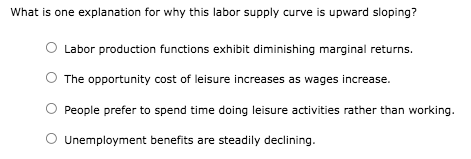
Transcribed Image Text:What is one explanation for why this labor supply curve is upward sloping?
Labor production functions exhibit diminishing marginal returns.
The opportunity cost of leisure increases as wages increase.
People prefer to spend time doing leisure activities rather than working.
O Unemployment benefits are steadily declining.
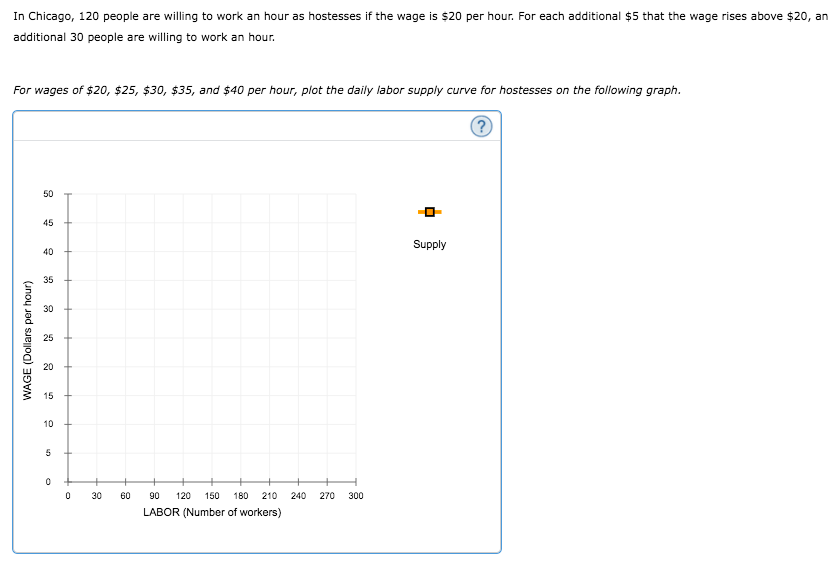
Transcribed Image Text:In Chicago, 120 people are willing to work an hour as hostesses if the wage is $20 per hour. For each additional $5 that the wage rises above $20, an
additional 30 people are willing to work an hour.
For wages of $20, $25, $30, $35, and $40 per hour, plot the daily labor supply curve for hostesses on the following graph.
50
45
Supply
40
35
30
25
20
15
10
5
30
60
90
120
150
180
210
240
270
300
LABOR (Number of workers)
WAGE (Dollars per hour)
Expert Solution
This question has been solved!
Explore an expertly crafted, step-by-step solution for a thorough understanding of key concepts.

This is a popular solution!

Trending now
This is a popular solution!

Step by step
Solved in 2 steps with 1 images

Knowledge Booster


Learn more about
Need a deep-dive on the concept behind this application? Look no further. Learn more about this topic, economics and related others by exploring similar questions and additional content below.Recommended textbooks for you

Microeconomics: Private and Public Choice (MindTa…
Economics
ISBN:
9781305506893
Author:
James D. Gwartney, Richard L. Stroup, Russell S. Sobel, David A. Macpherson
Publisher:
Cengage Learning

Economics: Private and Public Choice (MindTap Cou…
Economics
ISBN:
9781305506725
Author:
James D. Gwartney, Richard L. Stroup, Russell S. Sobel, David A. Macpherson
Publisher:
Cengage Learning
Microeconomics: Private and Public Choice (MindTa…
Economics
ISBN:
9781305506893
Author:
James D. Gwartney, Richard L. Stroup, Russell S. Sobel, David A. Macpherson
Publisher:
Cengage Learning
Economics: Private and Public Choice (MindTap Cou…
Economics
ISBN:
9781305506725
Author:
James D. Gwartney, Richard L. Stroup, Russell S. Sobel, David A. Macpherson
Publisher:
Cengage Learning


Exploring Economics
Economics
ISBN:
9781544336329
Author:
Robert L. Sexton
Publisher:
SAGE Publications, Inc

Essentials of Economics (MindTap Course List)
Economics
ISBN:
9781337091992
Author:
N. Gregory Mankiw
Publisher:
Cengage Learning