In order to estimate the average electricity usage per month, a sample of 125 residential customers were selected, and the monthly electricity usage was determined using the customers' meter readings. Assume a population variance of 12,100kWh2. Use Excel to find the 98% confidence interval for the mean electricity usage in kilowatt hours. Round your answers to two decimal places and use ascending order. Electric Usage

MATLAB: An Introduction with Applications
6th Edition
ISBN:9781119256830
Author:Amos Gilat
Publisher:Amos Gilat
Chapter1: Starting With Matlab
Section: Chapter Questions
Problem 1P
icon
Related questions
Topic Video
Question

In order to estimate the average electricity usage per month, a sample of 125 residential customers were selected, and the monthly electricity usage was determined using the customers' meter readings. Assume a population variance of 12,100kWh2. Use Excel to find the 98% confidence interval for the mean electricity usage in kilowatt hours. Round your answers to two decimal places and use ascending order.

Electric Usage

Electric Usage

765

1139

714

687

1027

1109

749

799

911

631

975

717

1232

806

637

894

856

896

1272

1224

621

606

898

723

817

746

933

595

851

1027

770

685

750

1198

975

678

1050

886

826

1176

583

841

1188

692

733

791

584

1163

593

1234

603

1044

1233

1178

598

904

778

693

590

845

893

1028

975

788

1240

1253

854

1185

1164

741

1058

1053

795

1198

1240

1140

959

938

1008

1035

1085

1100

680

1006

977

1042

1252

943

1165

1014

912

791

612

935

864

953

667

1005

1063

1095

1086

810

1032

970

1099

1229

892

1074

579

754

1007

1116

583

763

1231

966

962

1132

738

1033

697

891

840

725

1031

Expert Solution
Step 1

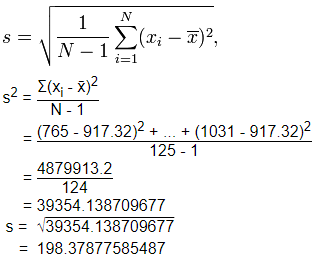
Calculating Mean and Standard Deviation for the given Data :

Standard Deviation, s: 198.3787

Count, N: 125
Sum, Σx: 114665
Mean, x̄: 917.32
Variance, s2 39354.1387


Statistics homework question answer, step 1, image 1

Also , given Population variance = 12,100

Population Standard Deviation = 12100 = 34.641

trending now

Trending now

This is a popular solution!

steps

Step by step

Solved in 2 steps with 1 images

Blurred answer
Knowledge Booster
Hypothesis Tests and Confidence Intervals for Means
Learn more about
Need a deep-dive on the concept behind this application? Look no further. Learn more about this topic, statistics and related others by exploring similar questions and additional content below.
Recommended textbooks for you
MATLAB: An Introduction with Applications
Statistics
ISBN:
9781119256830
Author:
Amos Gilat
Publisher:
John Wiley & Sons Inc
Probability and Statistics for Engineering and th…
Statistics
ISBN:
9781305251809
Author:
Jay L. Devore
Publisher:
Cengage Learning
Statistics for The Behavioral Sciences (MindTap C…
Statistics
ISBN:
9781305504912
Author:
Frederick J Gravetter, Larry B. Wallnau
Publisher:
Cengage Learning
Elementary Statistics: Picturing the World (7th E…
Statistics
ISBN:
9780134683416
Author:
Ron Larson, Betsy Farber
Publisher:
PEARSON
The Basic Practice of Statistics
Statistics
ISBN:
9781319042578
Author:
David S. Moore, William I. Notz, Michael A. Fligner
Publisher:
W. H. Freeman
Introduction to the Practice of Statistics
Statistics
ISBN:
9781319013387
Author:
David S. Moore, George P. McCabe, Bruce A. Craig
Publisher:
W. H. Freeman