In practice the standard solutions are made by pipetting a known amount of a stock solution with a certain amount of distilled water. Assuming the stock solution is 900. µM, determine the concentrations of the standards A through E (give your values to three sig figs). Soln ml stock ml distilled standard conc absorbance water (µM) A 5.00 5.00 5.00 9.00 5.00 13.00 5.00 17.00 5.00 21.00
In practice the standard solutions are made by pipetting a known amount of a stock solution with a certain amount of distilled water. Assuming the stock solution is 900. µM, determine the concentrations of the standards A through E (give your values to three sig figs). Soln ml stock ml distilled standard conc absorbance water (µM) A 5.00 5.00 5.00 9.00 5.00 13.00 5.00 17.00 5.00 21.00

Principles of Instrumental Analysis
7th Edition
ISBN:9781305577213
Author:Douglas A. Skoog, F. James Holler, Stanley R. Crouch
Publisher:Douglas A. Skoog, F. James Holler, Stanley R. Crouch
Chapter9: Atomic Absorption And Atomic Fluorescence Spectrometry
Section: Chapter Questions
Problem 9.23QAP

Related questions
Question
100%
Determine the standard concentration of A through E and then the absorbance. I just need clarification on if I add together the two ml values given.
Transcribed Image Text:Chem 116L; Fundamentals of Chemistry 1I Laboratory: Calibration Curves (Virtual Lab)
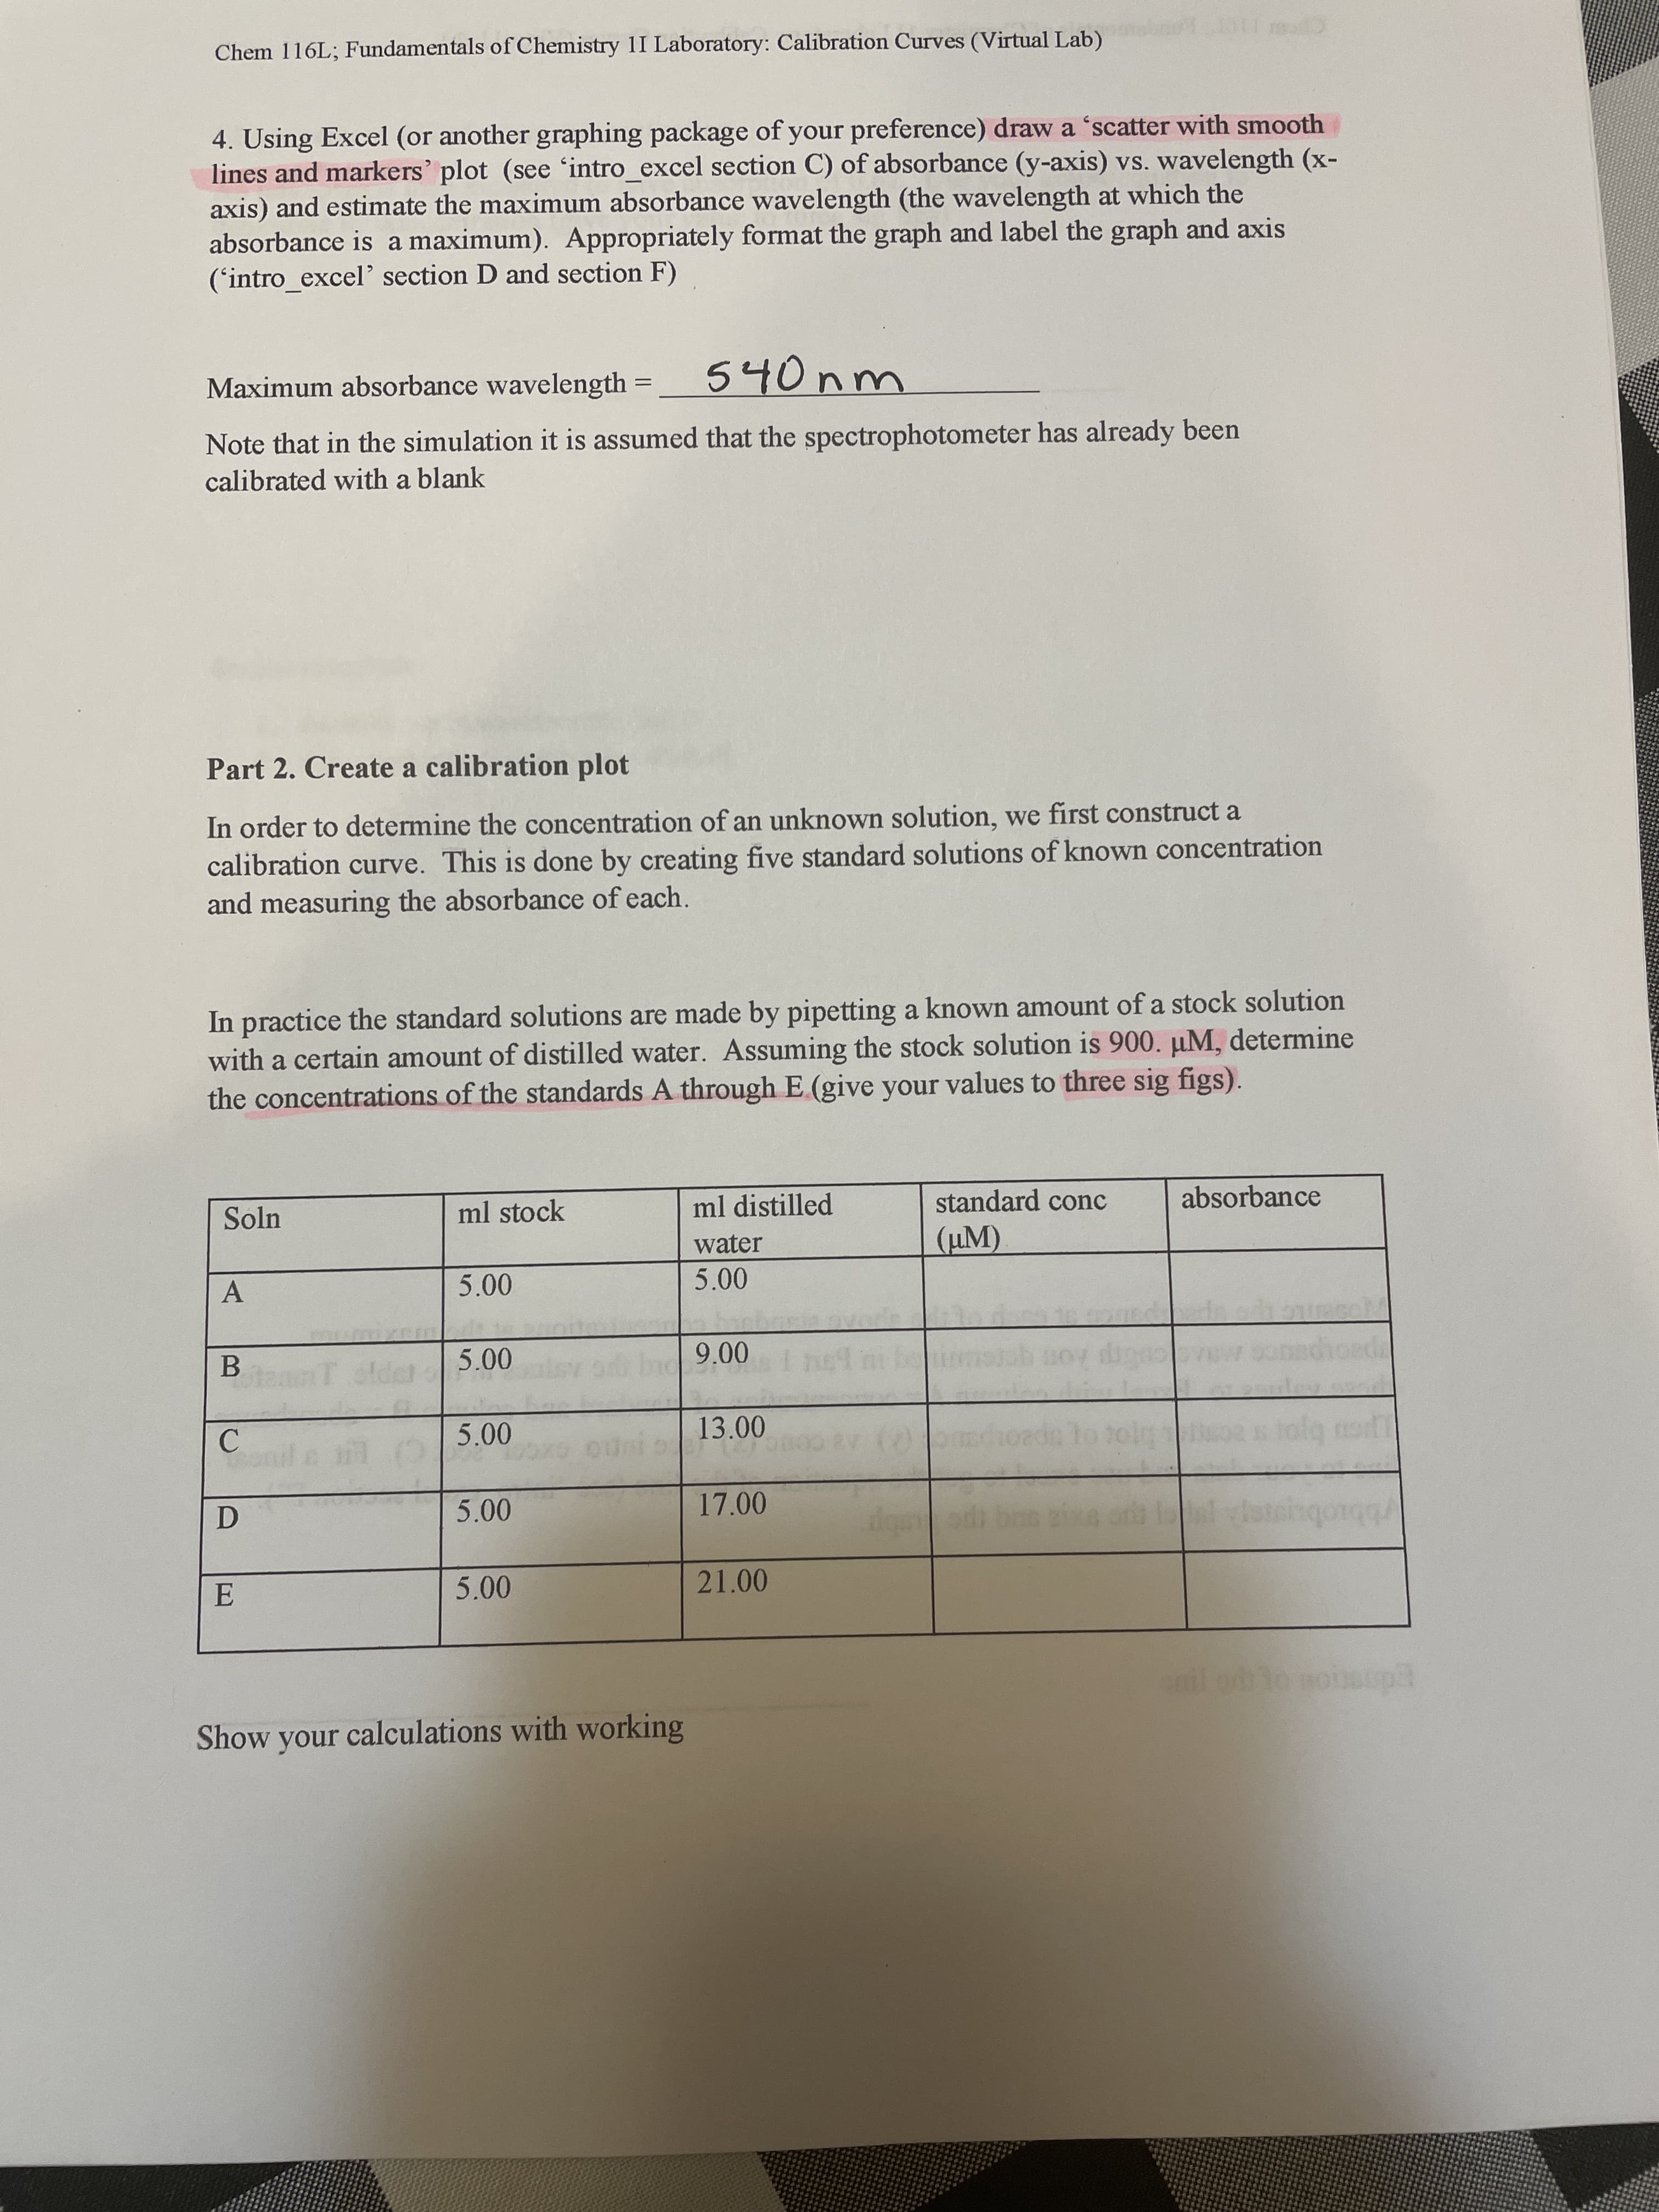
4. Using Excel (or another graphing package of your preference) draw a 'scatter with smooth
lines and markers' plot (see 'intro_excel section C) of absorbance (y-axis) vs. wavelength (x-
axis) and estimate the maximum absorbance wavelength (the wavelength at which the
absorbance is a maximum). Appropriately format the graph and label the graph and axis
('intro_excel' section D and section F)
Maximum absorbance wavelength
540nm
Note that in the simulation it is assumed that the spectrophotometer has already been
calibrated with a blank
Part 2. Create a calibration plot
In order to determine the concentration of an unknown solution, we first construct a
calibration curve. This is done by creating five standard solutions of known concentration
and measuring the absorbance of each.
In practice the standard solutions are made by pipetting a known amount of a stock solution
with a certain amount of distilled water. Assuming the stock solution is 900. µM, determine
the concentrations of the standards A through E (give your values to three sig figs).
Soln
ml stock
ml distilled
standard conc
absorbance
water
(µM).
A.
B.
teanT old
00 6
13.00
C.
17.00
D.
5.00
21.00
Show your calculations with working
Expert Solution
This question has been solved!
Explore an expertly crafted, step-by-step solution for a thorough understanding of key concepts.

This is a popular solution!

Trending now
This is a popular solution!

Step by step
Solved in 3 steps with 1 images

Recommended textbooks for you
Principles of Instrumental Analysis
Chemistry
ISBN:
9781305577213
Author:
Douglas A. Skoog, F. James Holler, Stanley R. Crouch
Publisher:
Cengage Learning

Organic Chemistry
Chemistry
ISBN:
9781305580350
Author:
William H. Brown, Brent L. Iverson, Eric Anslyn, Christopher S. Foote
Publisher:
Cengage Learning
Principles of Instrumental Analysis
Chemistry
ISBN:
9781305577213
Author:
Douglas A. Skoog, F. James Holler, Stanley R. Crouch
Publisher:
Cengage Learning
Organic Chemistry
Chemistry
ISBN:
9781305580350
Author:
William H. Brown, Brent L. Iverson, Eric Anslyn, Christopher S. Foote
Publisher:
Cengage Learning