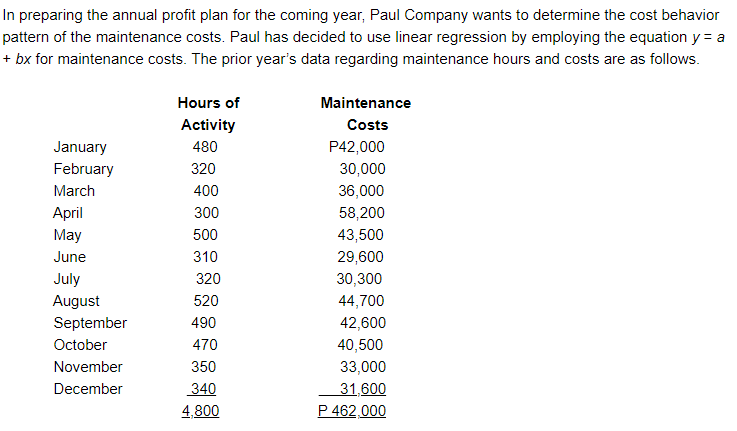
In preparing the annual profit plan for the coming year, Paul Company wants to determine the cost behavior pattern of the maintenance costs. Paul has decided to use linear regression by employing the equation y = a + bx for maintenance costs. The prior year's data regarding maintenance hours and costs are as follows. Hours of Maintenance Activity Costs January 480 P42,000 February 320 30,000 March 400 36,000 Аpril 300 58,200 May 500 43,500 June 310 29,600 July 320 30,300 August 520 44,700 September 490 42,600 October 470 40,500 November 350 33,000 December 340 31,600 4.800 P 462 000


Correlation
Correlation defines a relationship between two independent variables. It tells the degree to which variables move in relation to each other. When two sets of data are related to each other, there is a correlation between them.
Linear Correlation
A correlation is used to determine the relationships between numerical and categorical variables. In other words, it is an indicator of how things are connected to one another. The correlation analysis is the study of how variables are related.
Regression Analysis
Regression analysis is a statistical method in which it estimates the relationship between a dependent variable and one or more independent variable. In simple terms dependent variable is called as outcome variable and independent variable is called as predictors. Regression analysis is one of the methods to find the trends in data. The independent variable used in Regression analysis is named Predictor variable. It offers data of an associated dependent variable regarding a particular outcome.
QUESTIONS ARE:
1.Using linear
2.Refer to Paul Company. Using linear regression analysis, the estimated fixed cost per month for maintenance is closest to
3.Refer to Paul Company. Based upon the data derived from the regression analysis, 450 maintenance hours
in a month would
(rounded to the nearest peso) would be budgeted at

Step by step
Solved in 5 steps


