In the Chapter Preview we described a study showing that students had more academic problems following nights with less than average sleep compared to nights with more than average sleep (Gillen-O’Neel, Huynh, & Fuligni, 2013). Suppose a researcher is attempting to replicate this study using a sample of n = 8 college freshmen. Each student records the amount of study time and amount of sleep each night and reports the number of academic problems each day. The following data show the results from the study Treat the data as if the scores are from an independent-measures study using two separate samples, each with n = 8 participants. Compute the pooled variance, the estimated standard error for the mean difference, and the independent-measures t statistic. Using a two-tailed test with α = .05, is there a significant difference between the two sets of scores? b. Now assume that the data are from a repeatedmeasures study using the same sample of n = 8 participants in both treatment conditions. Compute the variance for the sample of difference scores, the estimated standard error for the mean difference and the repeated-measures t statistic. Using a two-tailed test with α = .05, is there a significant difference between the two sets of scores? (You should find that the repeated-measures design substantially reduces the variance and increases the likelihood of rejecting H0.
In the Chapter Preview we described a study showing that students had more academic problems following nights with less than average sleep compared to nights with more than average sleep (Gillen-O’Neel, Huynh, & Fuligni, 2013). Suppose a researcher is attempting to replicate this study using a sample of n = 8 college freshmen. Each student records the amount of study time and amount of sleep each night and reports the number of academic problems each day. The following data show the results from the study Treat the data as if the scores are from an independent-measures study using two separate samples, each with n = 8 participants. Compute the pooled variance, the estimated standard error for the mean difference, and the independent-measures t statistic. Using a two-tailed test with α = .05, is there a significant difference between the two sets of scores? b. Now assume that the data are from a repeatedmeasures study using the same sample of n = 8 participants in both treatment conditions. Compute the variance for the sample of difference scores, the estimated standard error for the mean difference and the repeated-measures t statistic. Using a two-tailed test with α = .05, is there a significant difference between the two sets of scores? (You should find that the repeated-measures design substantially reduces the variance and increases the likelihood of rejecting H0.

MATLAB: An Introduction with Applications
6th Edition
ISBN:9781119256830
Author:Amos Gilat
Publisher:Amos Gilat
Chapter1: Starting With Matlab
Section: Chapter Questions
Problem 1P

Related questions
Question
In the Chapter Preview we described a study showing that students had more academic problems following nights with less than average sleep compared to nights with more than average sleep (Gillen-O’Neel, Huynh, & Fuligni, 2013). Suppose a researcher is attempting to replicate this study using a sample of n = 8 college freshmen. Each student records the amount of study time and amount of sleep each night and reports the number of academic problems each day. The following data show the results from the study
- Treat the data as if the scores are from an independent-measures study using two separate samples, each with n = 8 participants. Compute the pooled variance, the estimated standard error for the mean difference, and the independent-measures t statistic. Using a two-tailed test with α = .05, is there a significant difference between the two sets of scores? b. Now assume that the data are from a repeatedmeasures study using the same sample of n = 8 participants in both treatment conditions. Compute the variance for the sample of difference scores, the estimated standard error for the mean difference and the repeated-measures t statistic. Using a two-tailed test with α = .05, is there a significant difference between the two sets of scores? (You should find that the repeated-measures design substantially reduces the variance and increases the likelihood of rejecting H0.
Transcribed Image Text:20. Participants enter a research study with unique
characteristics that produce different scores from
one person to another. For an independent-measures
study, these individual differences can canse prob-
lems. Identify the problems and briefly explain how
they are eliminated or reduced with a repeated-
measures study.
22. The prev
ing indiv
variance
benefit on
consisten
for examp
in the mo
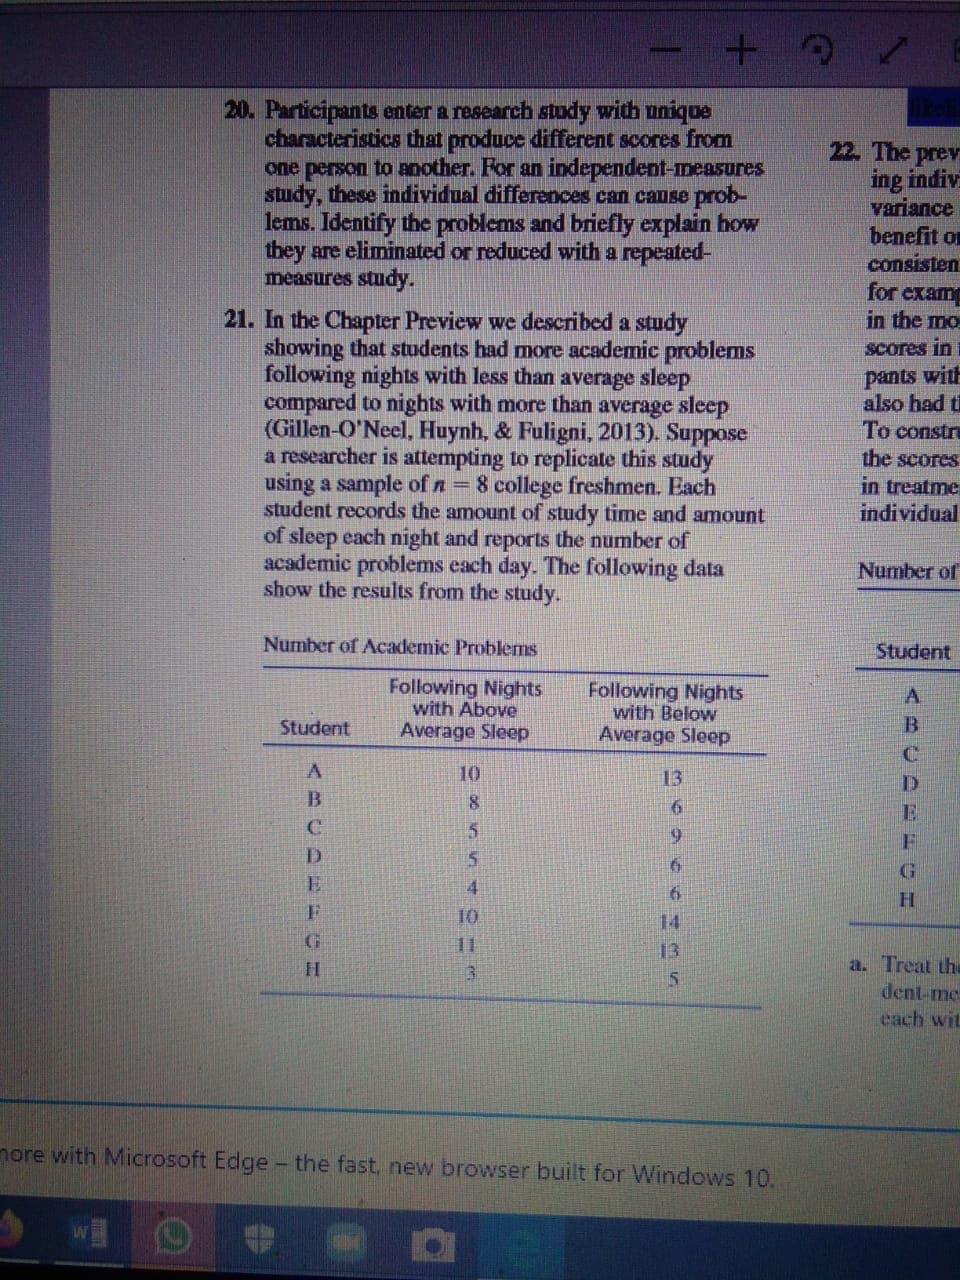
21. In the Chapter Preview we described a study
showing that students had more academic problems
following nights with less than average sleep
compared to nights with more than average sleep
(Gillen-O'Neel, Huynh, & Fuligni, 2013). Suppose
a researcher is attempting to replicate this study
using a sample of n = 8 college freshmen. Each
student records the amount of study time and amount
of sleep each night and reports the number of
academic problems each day. The following data
show the results from the study.
Scores in
pants with
also had ti
To constru
the scores
in treatme
individual
Number of
Number of Academic Problems
Student
Following Nights
with Above
Average Sleep
Following Nights
with Below
Average Sleep
Student
B.
10
13
B.
8.
E
5.
6.
D
H.
F
10
14
11
13
a. Treat the
dent-me
each wit
nore with Microsoft Edge - the fast, new browser built for Windows 10.
Transcribed Image Text:%20Larry%20B%20-%20Statistics%20for%20the%20behavioral%20sc
it to width
Page view
A Read aloud
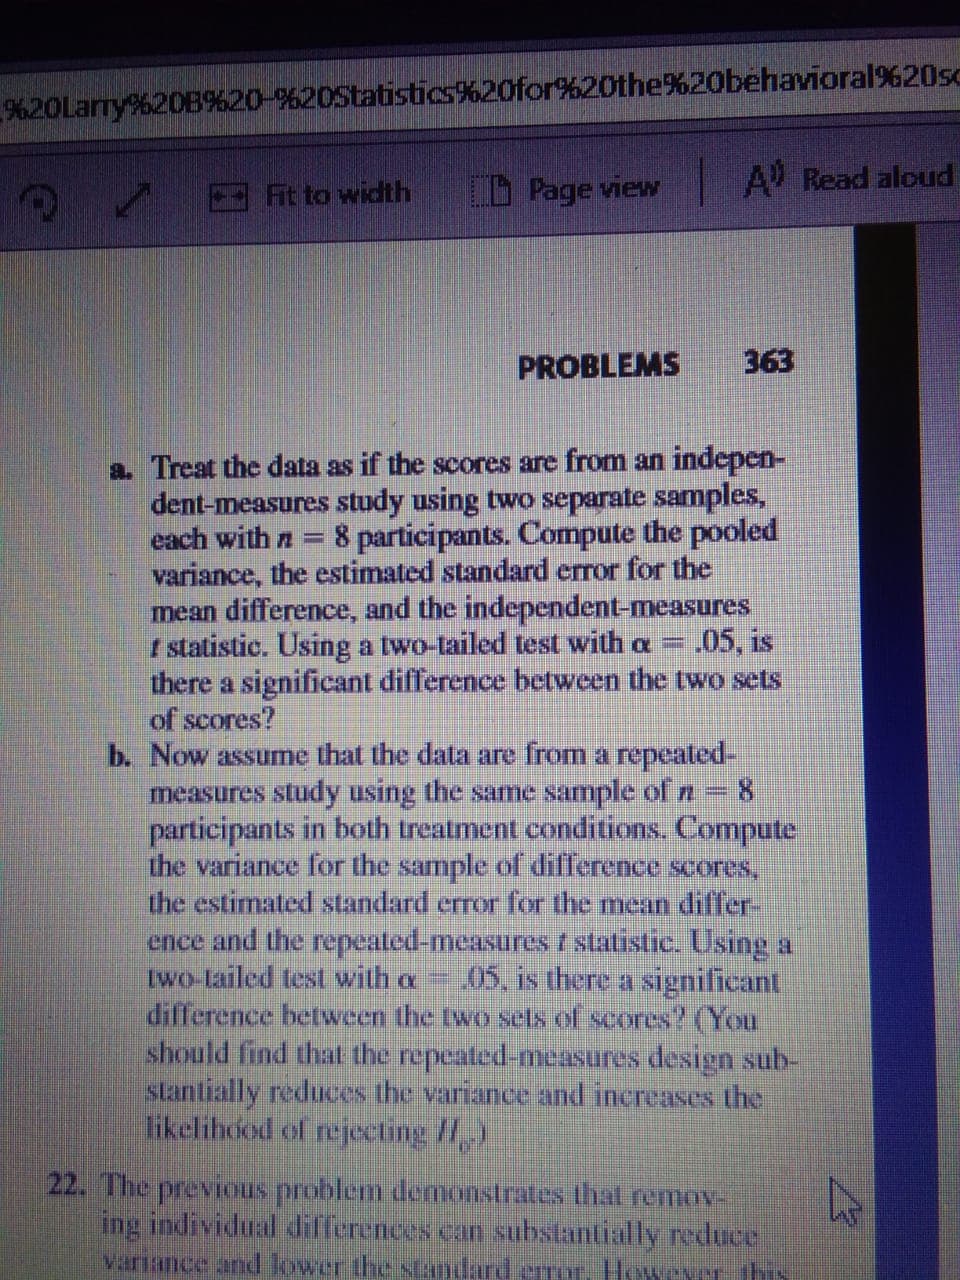
PROBLEMS
363
a. Treat the data as if the scores are from an indepen-
dent-measures study using two separate samples,
each with n=
8 participants. Compute the pooled
variance, the estimated standard error for the
mean difference, and the independent-measures
I statistic. Using a two-tailed test with a =
there a significant difference between the two sets
of scores?
b. Now assume that the data are from a repeated-
measures study using the same sample of n = 8
participants in both treatment conditions. Compute
the variance for the sample of difference scores,
the estimated standard error for the mean differ-
ence and the repeated-measures f statistic. Using a
two-tailed tes with a
difference between the two sels of scores? (You
should find that the repeated-measures design sub-
stantially reduces the variance and increases the
likelihood of rejecting /,)
.05, is
05, is there a significant
22. The previous problem demonstrates that remov
ing individual differences can substantially reduce
variance and lower the sAndard erroT. However this
Expert Solution
This question has been solved!
Explore an expertly crafted, step-by-step solution for a thorough understanding of key concepts.

This is a popular solution!

Trending now
This is a popular solution!

Step by step
Solved in 2 steps with 5 images

Recommended textbooks for you
MATLAB: An Introduction with Applications
Statistics
ISBN:
9781119256830
Author:
Amos Gilat
Publisher:
John Wiley & Sons Inc

Probability and Statistics for Engineering and th…
Statistics
ISBN:
9781305251809
Author:
Jay L. Devore
Publisher:
Cengage Learning

Statistics for The Behavioral Sciences (MindTap C…
Statistics
ISBN:
9781305504912
Author:
Frederick J Gravetter, Larry B. Wallnau
Publisher:
Cengage Learning
MATLAB: An Introduction with Applications
Statistics
ISBN:
9781119256830
Author:
Amos Gilat
Publisher:
John Wiley & Sons Inc
Probability and Statistics for Engineering and th…
Statistics
ISBN:
9781305251809
Author:
Jay L. Devore
Publisher:
Cengage Learning
Statistics for The Behavioral Sciences (MindTap C…
Statistics
ISBN:
9781305504912
Author:
Frederick J Gravetter, Larry B. Wallnau
Publisher:
Cengage Learning

Elementary Statistics: Picturing the World (7th E…
Statistics
ISBN:
9780134683416
Author:
Ron Larson, Betsy Farber
Publisher:
PEARSON

The Basic Practice of Statistics
Statistics
ISBN:
9781319042578
Author:
David S. Moore, William I. Notz, Michael A. Fligner
Publisher:
W. H. Freeman

Introduction to the Practice of Statistics
Statistics
ISBN:
9781319013387
Author:
David S. Moore, George P. McCabe, Bruce A. Craig
Publisher:
W. H. Freeman