In the graph, the economy is in long-run equilibrium at point A. LRAS, SRAS, Now, assume that there is an unexpected increase in the price of oil. 1.) Use the line drawing tool to show the resulting short-run equilibrium on your diagram. Label any new aggregate demand or aggregate supply curve as AD2 SRAS, or LRAS2 as appropriate. 2.) Use the point drawing tool to locate the new short- run equilibrium point. Label this point B. Carefully follow the instructions above, and only draw the required objects. AD1 Real GDP (trillions of 2012 dollars) Price level (GDP Deflator, 2012 = 100)
In the graph, the economy is in long-run equilibrium at point A. LRAS, SRAS, Now, assume that there is an unexpected increase in the price of oil. 1.) Use the line drawing tool to show the resulting short-run equilibrium on your diagram. Label any new aggregate demand or aggregate supply curve as AD2 SRAS, or LRAS2 as appropriate. 2.) Use the point drawing tool to locate the new short- run equilibrium point. Label this point B. Carefully follow the instructions above, and only draw the required objects. AD1 Real GDP (trillions of 2012 dollars) Price level (GDP Deflator, 2012 = 100)

Chapter14: Aggregate Demand And Supply
Section14.A: The Self Correcting Aggregate Demand And Supply Model
Problem 1SQP

Related questions
Question
Help plotting points and labeling
Transcribed Image Text:End of Chapter 3.55
Question
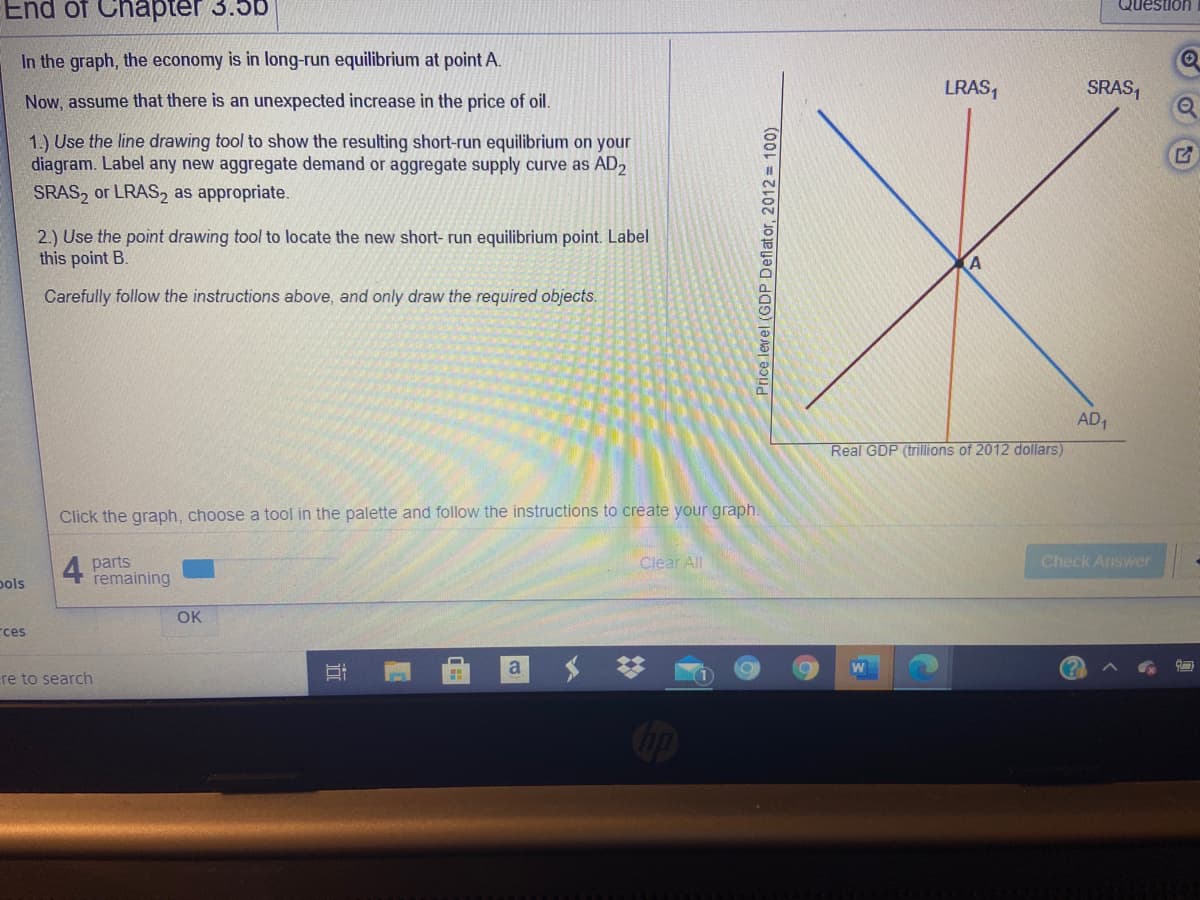
In the graph, the economy is in long-run equilibrium at point A.
LRAS,
SRAS,
Now, assume that there is an unexpected increase in the price of oil.
1.) Use the line drawing tool to show the resulting short-run equilibrium on your
diagram. Label any new aggregate demand or aggregate supply curve as AD2
SRAS, or LRAS2 as appropriate.
2.) Use the point drawing tool to locate the new short- run equilibrium point. Label
this point B.
Carefully follow the instructions above, and only draw the required objects.
AD1
Real GDP (trillions of 2012 dollars)
Click the graph, choose a tool in the palette and follow the instructions to create your graph.
4 parts
remaining
Clear All
Check Answer
pols
OK
rces
a
re to search
op
Price level (GDP Deflator, 2012 = 100)
Expert Solution
This question has been solved!
Explore an expertly crafted, step-by-step solution for a thorough understanding of key concepts.

This is a popular solution!

Trending now
This is a popular solution!

Step by step
Solved in 2 steps with 1 images

Knowledge Booster


Learn more about
Need a deep-dive on the concept behind this application? Look no further. Learn more about this topic, economics and related others by exploring similar questions and additional content below.Recommended textbooks for you


Economics: Private and Public Choice (MindTap Cou…
Economics
ISBN:
9781305506725
Author:
James D. Gwartney, Richard L. Stroup, Russell S. Sobel, David A. Macpherson
Publisher:
Cengage Learning

Macroeconomics: Private and Public Choice (MindTa…
Economics
ISBN:
9781305506756
Author:
James D. Gwartney, Richard L. Stroup, Russell S. Sobel, David A. Macpherson
Publisher:
Cengage Learning

Brief Principles of Macroeconomics (MindTap Cours…
Economics
ISBN:
9781337091985
Author:
N. Gregory Mankiw
Publisher:
Cengage Learning