
ENGR.ECONOMIC ANALYSIS
14th Edition
ISBN: 9780190931919
Author: NEWNAN
Publisher: Oxford University Press
expand_more
expand_more
format_list_bulleted
Related questions
Question

Transcribed Image Text:The text reads:
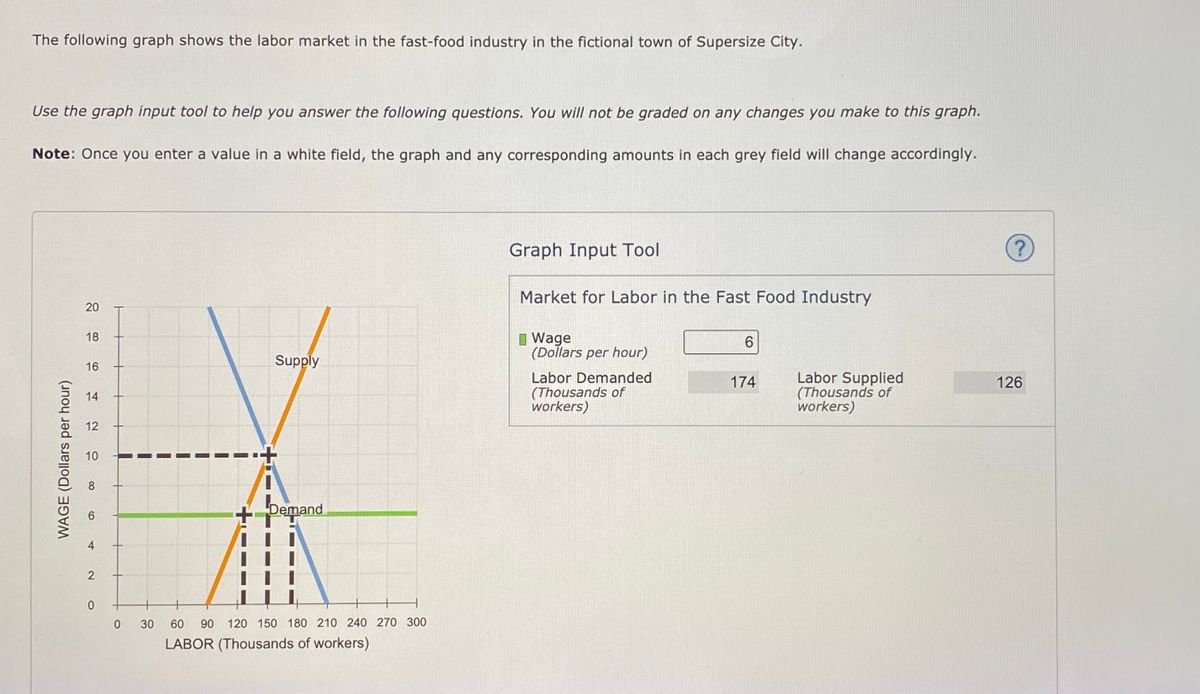
"The following graph shows the labor market in the fast-food industry in the fictional town of Supersize City.
Use the graph input tool to help you answer the following questions. You will not be graded on any changes you make to this graph.
Note: Once you enter a value in a white field, the graph and any corresponding amounts in each grey field will change accordingly."
Graph Description:
The graph is titled "Market for Labor in the Fast Food Industry." It has the following components:
- **Axes**:
- The vertical axis represents "WAGE (Dollars per hour)" ranging from 0 to 20.
- The horizontal axis represents "LABOR (Thousands of workers)" ranging from 0 to 300.
- **Supply Curve**: Shown in blue, labeled "Supply," it slopes upwards from left to right, indicating that as wages increase, the labor supplied increases.
- **Demand Curve**: Shown in orange, labeled "Demand," it slopes downwards from left to right, indicating that as wages increase, the labor demanded decreases.
- **Equilibrium**: The point where the supply and demand curves intersect, showing the market equilibrium for wages and labor quantity.
- **Dashed Line**: A horizontal dashed line at \( \text{\$6} \) wage level shows the current price setting or control under consideration.
Graph Input Tool:
- Fields:
- **Wage (Dollars per hour)**: Input value \( 6 \)
- **Labor Demanded (Thousands of workers)**: Display value \( 174 \)
- **Labor Supplied (Thousands of workers)**: Display value \( 126 \)
This graph illustrates the dynamics of the fast-food labor market in Supersize City, showing how the wage rate influences the supply and demand for labor.

Transcribed Image Text:In this market, the equilibrium hourly wage is $____, and the equilibrium quantity of labor is _____ thousand workers.
Suppose a senator introduces a bill to legislate a minimum hourly wage of $6. This type of price control is called a __________.
For each of the wages listed in the following table, determine the quantity of labor demanded, the quantity of labor supplied, and the direction of pressure exerted on wages in the absence of any price controls.
| Wage (Dollars per hour) | Labor Demanded (Thousands of workers) | Labor Supplied (Thousands of workers) | Pressure on Wages |
|------------------------|--------------------------------------|-------------------------------------|-------------------|
| 8 | | | |
| 12 | | | |
True or False: A minimum wage below $10 per hour is not a binding minimum wage in this market.
- ☐ True
- ☐ False
**Description of Graph:**
There is a graph displayed above with two intersecting lines representing labor demand and supply. The x-axis shows the quantity of labor in thousands of workers, and the y-axis illustrates the wage rate in dollars per hour. The intersection of these two lines indicates the market equilibrium for wages and labor quantity.
Expert Solution
This question has been solved!
Explore an expertly crafted, step-by-step solution for a thorough understanding of key concepts.

This is a popular solution

Trending nowThis is a popular solution!

Step by stepSolved in 2 steps

Knowledge Booster


Learn more about
Need a deep-dive on the concept behind this application? Look no further. Learn more about this topic, economics and related others by exploring similar questions and additional content below.Similar questions
- What are the pros and cons of increasing the minimum wagearrow_forward9. Minimum wage legislation The following graph shows the labor market in the fast-food industry in the fictional town of Supersize City. Use the graph input tool to help you answer the following questions. You will not be graded on any changes you make to this graph. Note: Once you enter a value in a white field, the graph and any corresponding amounts in each grey field will change accordingly. Graph Input Tool ?) 20 Market for Labor in the Fast Food Industry 18 I Wage (Dollars per hour) 16 Labor Supplied (Thousands of workers) Supply Labor Demanded 900 14 (Thousands of workers) 12 10 8 Demand 4. 0. 90 180 270 360 450 540 630 720 810 900 LABOR (Thousands of workers) WAGE (Dollars per hour)arrow_forwardThe graph below shows the market for labor (coal miners). New coal-mining equipment is invented that is cheap and requires fewer workers to run. Demonstrate the effect this equipment has on the demand for coal miners. Provide your answer below: Wage Supply New Equilibrium Original Equilibrium Demand Quantity of Coal Minersarrow_forward
- Which of the following is the most likely outcome of minimum wage laws? an increase in both the quantity of labor supplied by workers and the quantity of labor demanded by firms an increase in the quantity of labor supplied by workers and a decrease in the quantity of labor demanded by firms a decrease in the quantity of labor supplied by workers and an increase in the quantity of labor demanded by firms a decrease in both the quantity of labor supplied by workers and the quantity of labor demanded by firmsarrow_forwardSuppose labor demand for low-skilled workers in the United States is w = 35 – 0.2Ewhere E is the number of workers (in millions) and w is the hourly wage. There are 100 million domestic U.S. low-skilled workers who supply labor inelastically. If the U.S. opened its borders to immigration, 25 million low-skill immigrants would enter the U.S. and supply labor inelastically. What is the market-clearing wage if immigration is not allowed? What is the market-clearing wage with open borders?arrow_forwardExplain the challenges of an increasing minimum wage for an economyarrow_forward
- 6.4arrow_forwardassume that a minimum wage already exists in society. Please explain the effects on the economy of increasing the minimum wage. Be sure to discuss who gains and who loses(Consumer and Producer surplus) as well the inefficiencies that this price floor would create. Make sure you show this graphically as well.arrow_forwardHere in the U.S. the government has subsidized come college costs with various grants and in some cases low interest loan programs. This fact illustrates that there is a price ceiling when it comes to college costs here in the U.S. True Falsearrow_forward
arrow_back_ios
arrow_forward_ios
Recommended textbooks for you
 Principles of Economics (12th Edition)EconomicsISBN:9780134078779Author:Karl E. Case, Ray C. Fair, Sharon E. OsterPublisher:PEARSON
 Engineering Economy (17th Edition)EconomicsISBN:9780134870069Author:William G. Sullivan, Elin M. Wicks, C. Patrick KoellingPublisher:PEARSON
 Principles of Economics (MindTap Course List)EconomicsISBN:9781305585126Author:N. Gregory MankiwPublisher:Cengage Learning
 Managerial Economics: A Problem Solving ApproachEconomicsISBN:9781337106665Author:Luke M. Froeb, Brian T. McCann, Michael R. Ward, Mike ShorPublisher:Cengage Learning
 Managerial Economics & Business Strategy (Mcgraw-...EconomicsISBN:9781259290619Author:Michael Baye, Jeff PrincePublisher:McGraw-Hill Education
Principles of Economics (12th Edition)
Economics
ISBN:9780134078779
Author:Karl E. Case, Ray C. Fair, Sharon E. Oster
Publisher:PEARSON
Engineering Economy (17th Edition)
Economics
ISBN:9780134870069
Author:William G. Sullivan, Elin M. Wicks, C. Patrick Koelling
Publisher:PEARSON
Principles of Economics (MindTap Course List)
Economics
ISBN:9781305585126
Author:N. Gregory Mankiw
Publisher:Cengage Learning
Managerial Economics: A Problem Solving Approach
Economics
ISBN:9781337106665
Author:Luke M. Froeb, Brian T. McCann, Michael R. Ward, Mike Shor
Publisher:Cengage Learning
Managerial Economics & Business Strategy (Mcgraw-...
Economics
ISBN:9781259290619
Author:Michael Baye, Jeff Prince
Publisher:McGraw-Hill Education