The following graph shows the labor market for research assistants in the fictional country of Collegia. The equilibrium wage is $10 per hour, and the equilibrium number of research assistants is 200. Suppose the government has decided to institute a $4-per-hour payroll tax on research assistants and is trying to determine whether the tax should be levied on the employer, the workers, or both (such that half the tax is collected from each side). Use the graph input tool to evaluate these three proposals. Entering a number into the Tax Levied on Employers field (initially set at zero dollars per hour) shifts the demand curve down by the amount you enter, and entering a number into the Tax Levied on Workers field (initially set at zero dollars per hour) shifts the supply curve up by the amount you enter. To determine the before-tax wage for each tax proposal, adjust the amount in the Wage field until the quantity of labor supplied equals the quantity of labor demanded. You will not be graded on any changes you make to this graph.
The following graph shows the labor market for research assistants in the fictional country of Collegia. The equilibrium wage is $10 per hour, and the equilibrium number of research assistants is 200. Suppose the government has decided to institute a $4-per-hour payroll tax on research assistants and is trying to determine whether the tax should be levied on the employer, the workers, or both (such that half the tax is collected from each side). Use the graph input tool to evaluate these three proposals. Entering a number into the Tax Levied on Employers field (initially set at zero dollars per hour) shifts the demand curve down by the amount you enter, and entering a number into the Tax Levied on Workers field (initially set at zero dollars per hour) shifts the supply curve up by the amount you enter. To determine the before-tax wage for each tax proposal, adjust the amount in the Wage field until the quantity of labor supplied equals the quantity of labor demanded. You will not be graded on any changes you make to this graph.

Chapter1: Making Economics Decisions
Section: Chapter Questions
Problem 1QTC

Related questions
Question
The following graph shows the labor market for research assistants in the fictional country of Collegia. The equilibrium wage is $10 per hour, and the equilibrium number of research assistants is 200.
Suppose the government has decided to institute a $4-per-hour payroll tax on research assistants and is trying to determine whether the tax should be levied on the employer, the workers, or both (such that half the tax is collected from each side).
Use the graph input tool to evaluate these three proposals. Entering a number into the Tax Levied on Employers field (initially set at zero dollars per hour) shifts the demand curve down by the amount you enter, and entering a number into the Tax Levied on Workers field (initially set at zero dollars per hour) shifts the supply curve up by the amount you enter. To determine the before-tax wage for each tax proposal, adjust the amount in the Wage field until the quantity of labor supplied equals the quantity of labor demanded. You will not be graded on any changes you make to this graph.
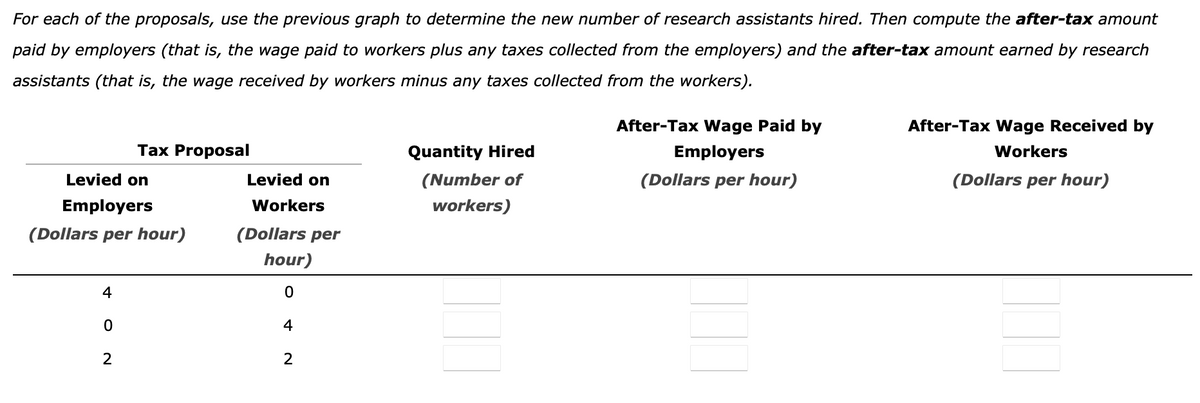
Transcribed Image Text:For each of the proposals, use the previous graph to determine the new number of research assistants hired. Then compute the after-tax amount
paid by employers (that is, the wage paid to workers plus any taxes collected from the employers) and the after-tax amount earned by research
assistants (that is, the wage received by workers minus any taxes collected from the workers).
After-Tax Wage Paid by
After-Tax Wage Received by
Tax Proposal
Quantity Hired
Employers
Workers
Levied on
Levied on
(Number of
(Dollars per hour)
(Dollars per hour)
Employers
Workers
workers)
(Dollars per hour)
(Dollars per
hour)
4
4
2
2
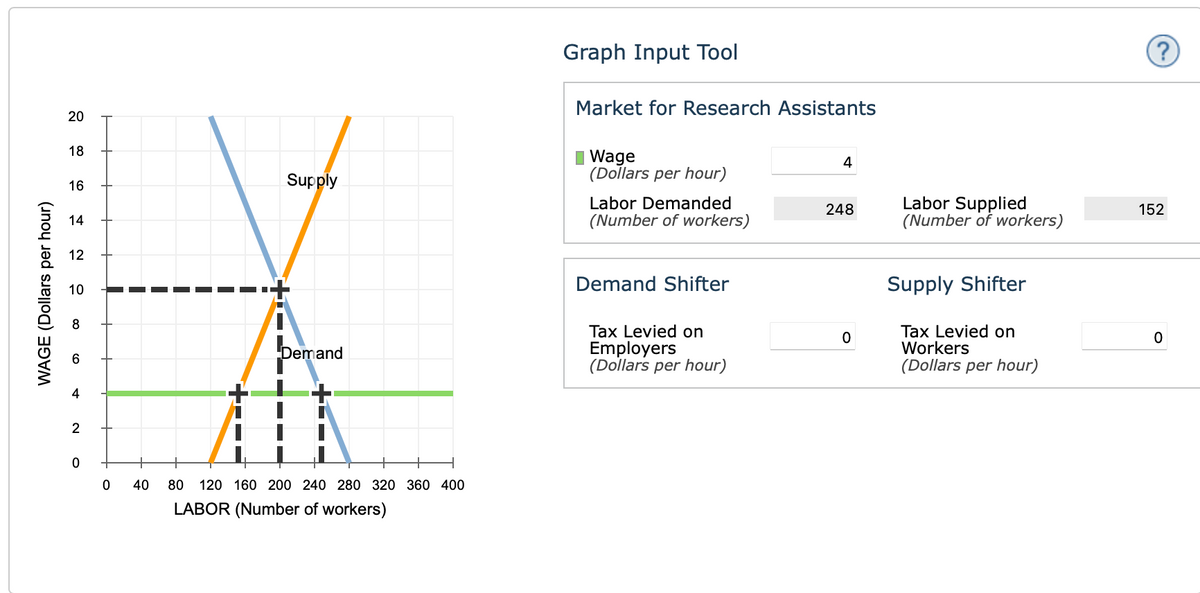
Transcribed Image Text:Graph Input Tool
(?
Market for Research Assistants
20
18
I Wage
(Dollars per hour)
4
16
Supply
Labor Demanded
(Number of workers)
Labor Supplied
(Number of workers)
248
152
14
12
Demand Shifter
Supply Shifter
10
Tax Levied on
Employers
(Dollars per hour)
Tax Levied on
Workers
(Dollars per hour)
Demand
4
2
40
80 120 160 200 240 280 320 360 400
LABOR (Number of workers)
WAGE (Dollars per hour)
Expert Solution
This question has been solved!
Explore an expertly crafted, step-by-step solution for a thorough understanding of key concepts.

This is a popular solution!

Trending now
This is a popular solution!

Step by step
Solved in 3 steps with 5 images

Knowledge Booster


Learn more about
Need a deep-dive on the concept behind this application? Look no further. Learn more about this topic, economics and related others by exploring similar questions and additional content below.Recommended textbooks for you

Principles of Economics (12th Edition)
Economics
ISBN:
9780134078779
Author:
Karl E. Case, Ray C. Fair, Sharon E. Oster
Publisher:
PEARSON

Engineering Economy (17th Edition)
Economics
ISBN:
9780134870069
Author:
William G. Sullivan, Elin M. Wicks, C. Patrick Koelling
Publisher:
PEARSON
Principles of Economics (12th Edition)
Economics
ISBN:
9780134078779
Author:
Karl E. Case, Ray C. Fair, Sharon E. Oster
Publisher:
PEARSON
Engineering Economy (17th Edition)
Economics
ISBN:
9780134870069
Author:
William G. Sullivan, Elin M. Wicks, C. Patrick Koelling
Publisher:
PEARSON

Principles of Economics (MindTap Course List)
Economics
ISBN:
9781305585126
Author:
N. Gregory Mankiw
Publisher:
Cengage Learning

Managerial Economics: A Problem Solving Approach
Economics
ISBN:
9781337106665
Author:
Luke M. Froeb, Brian T. McCann, Michael R. Ward, Mike Shor
Publisher:
Cengage Learning

Managerial Economics & Business Strategy (Mcgraw-…
Economics
ISBN:
9781259290619
Author:
Michael Baye, Jeff Prince
Publisher:
McGraw-Hill Education