inear correlation coefficient r, and find the P-value of r. Determine whether there is sufficient evidence to support a claim of linear correlation between the two variables. Should we expect that there would be a correlation? Use a significance level of a = 0.01. Click the icon to view the ages of the award winners. Construct a scatterplot. Choose the correct graph below. O A. В. C. O D. 70- 70 70- 70- 20+ 20 Best Actress (years) 20- 20- 20 Best Actress (years) 20- 20 Best Actress (years) 70 70 70 Best Actress (years) The linear correlation coefficient is r= Round to three decimal places as needed.) Best Actor (years) Best Actor (years) Best Actor (years) Best Actor (years)
inear correlation coefficient r, and find the P-value of r. Determine whether there is sufficient evidence to support a claim of linear correlation between the two variables. Should we expect that there would be a correlation? Use a significance level of a = 0.01. Click the icon to view the ages of the award winners. Construct a scatterplot. Choose the correct graph below. O A. В. C. O D. 70- 70 70- 70- 20+ 20 Best Actress (years) 20- 20- 20 Best Actress (years) 20- 20 Best Actress (years) 70 70 70 Best Actress (years) The linear correlation coefficient is r= Round to three decimal places as needed.) Best Actor (years) Best Actor (years) Best Actor (years) Best Actor (years)

Algebra & Trigonometry with Analytic Geometry
13th Edition
ISBN:9781133382119
Author:Swokowski
Publisher:Swokowski
Chapter1: Fundamental Concepts Of Algebra
Section1.4: Fractional Expressions
Problem 8E

Related questions
Question
confused
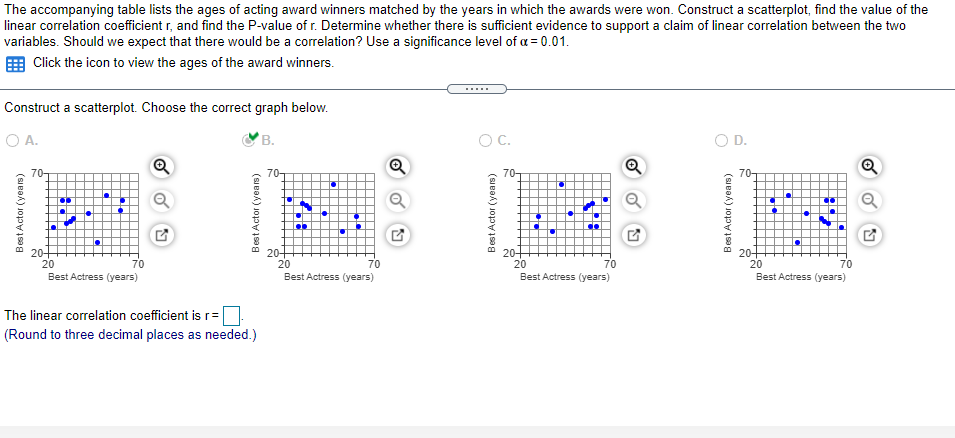
Transcribed Image Text:The accompanying table lists the ages of acting award winners matched by the years in which the awards were won. Construct a scatterplot, find the value of the
linear correlation coefficient r, and find the P-value of r. Determine whether there is sufficient evidence to support a claim of linear correlation between the two
variables. Should we expect that there would be a correlation? Use a significance level of a = 0.01.
Click the icon to view the ages of the award winners.
Construct a scatterplot. Choose the correct graph below.
O A.
В.
C.
O D.
70-
70-
70-
70-
20-
20
Best Actress (years)
20-
20
20+
20
20-
20
70
70
70
70
Best Actress (years)
Best Actress (years)
Best Actress (years)
The linear correlation coefficient is r=O
(Round to three decimal places as needed.)
Best Actor (years)
Best Actor (years)
Best Actor (years)
Best Actor (years)
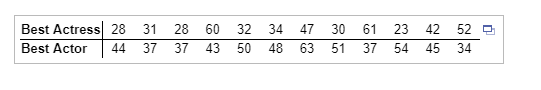
Transcribed Image Text:Best Actress
28
31
28
60
32
34
47
30
61
23
42 52 D
Best Actor
44
37
37
43
50
48
63
51
37
54
45
34
Expert Solution
This question has been solved!
Explore an expertly crafted, step-by-step solution for a thorough understanding of key concepts.

Step by step
Solved in 2 steps with 3 images

Recommended textbooks for you
Algebra & Trigonometry with Analytic Geometry
Algebra
ISBN:
9781133382119
Author:
Swokowski
Publisher:
Cengage

Algebra: Structure And Method, Book 1
Algebra
ISBN:
9780395977224
Author:
Richard G. Brown, Mary P. Dolciani, Robert H. Sorgenfrey, William L. Cole
Publisher:
McDougal Littell

Holt Mcdougal Larson Pre-algebra: Student Edition…
Algebra
ISBN:
9780547587776
Author:
HOLT MCDOUGAL
Publisher:
HOLT MCDOUGAL
Algebra & Trigonometry with Analytic Geometry
Algebra
ISBN:
9781133382119
Author:
Swokowski
Publisher:
Cengage
Algebra: Structure And Method, Book 1
Algebra
ISBN:
9780395977224
Author:
Richard G. Brown, Mary P. Dolciani, Robert H. Sorgenfrey, William L. Cole
Publisher:
McDougal Littell
Holt Mcdougal Larson Pre-algebra: Student Edition…
Algebra
ISBN:
9780547587776
Author:
HOLT MCDOUGAL
Publisher:
HOLT MCDOUGAL

Glencoe Algebra 1, Student Edition, 9780079039897…
Algebra
ISBN:
9780079039897
Author:
Carter
Publisher:
McGraw Hill

Mathematics For Machine Technology
Advanced Math
ISBN:
9781337798310
Author:
Peterson, John.
Publisher:
Cengage Learning,