Investigation Results – Using the given data, investigate the possible relationships between Life Expectancy as the response variable (y) and each of the three explanatory variables (x). For each x variable, you will complete the following steps. (Note: you will do parts a – d three times!) Construct a scatter diagram displaying the relationship between x and y. You can use graph paper and draw the diagram by hand, use your calculator and take a picture of the screen, or use the online site: https://www.desmos.com/, which will allow you to print or save your diagram. Calculate and state the sample correlation coefficient r. Describe the type of correlation, if any, and interpret the correlation in the context o-f the data
Investigation Results – Using the given data, investigate the possible relationships between Life Expectancy as the response variable (y) and each of the three explanatory variables (x). For each x variable, you will complete the following steps. (Note: you will do parts a – d three times!) Construct a scatter diagram displaying the relationship between x and y. You can use graph paper and draw the diagram by hand, use your calculator and take a picture of the screen, or use the online site: https://www.desmos.com/, which will allow you to print or save your diagram. Calculate and state the sample correlation coefficient r. Describe the type of correlation, if any, and interpret the correlation in the context o-f the data

MATLAB: An Introduction with Applications
6th Edition
ISBN:9781119256830
Author:Amos Gilat
Publisher:Amos Gilat
Chapter1: Starting With Matlab
Section: Chapter Questions
Problem 1P

Related questions
Question
- Investigation Results – Using the given data, investigate the possible relationships between Life Expectancy as the response variable (y) and each of the three explanatory variables (x). For each x variable, you will complete the following steps. (Note: you will do parts a – d three times!)
- Construct a
scatter diagram displaying the relationship between x and y.
You can use graph paper and draw the diagram by hand, use your calculator and take a picture of the screen, or use the online site: https://www.desmos.com/, which will allow you to print or save your diagram. - Calculate and state the sample
correlation coefficient r. - Describe the type of correlation, if any, and interpret the correlation in the context o-f the data.
- Determine if the correlation is significant. Use α = 0.05 and show all steps of this process.
- Construct a
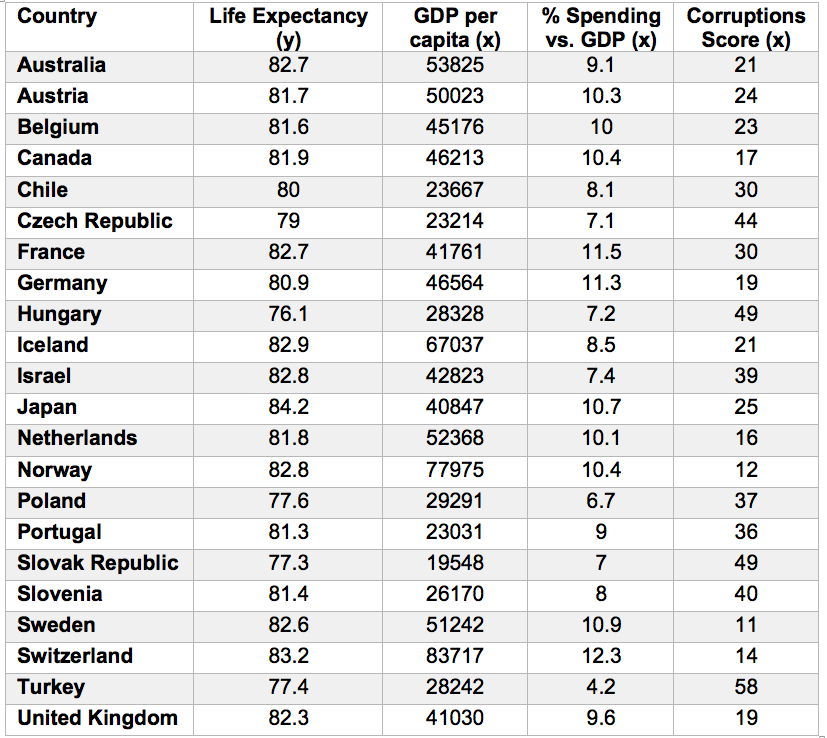
Transcribed Image Text:GDP per
Life Expectancy
(y)
82.7
% Spending Corruptions
vs. GDP (x)
Country
Score (x)
сapita (x)
53825
Australia
9.1
21
Austria
81.7
50023
10.3
24
Belgium
81.6
45176
10
23
Canada
81.9
46213
10.4
17
Chile
80
23667
8.1
30
Czech Republic
79
23214
7.1
44
France
82.7
41761
11.5
30
Germany
80.9
46564
11.3
19
Hungary
76.1
28328
7.2
49
Iceland
82.9
67037
8.5
21
Israel
82.8
42823
7.4
39
Japan
84.2
40847
10.7
25
Netherlands
81.8
52368
10.1
16
Norway
82.8
77975
10.4
12
Poland
77.6
29291
6.7
37
Portugal
Slovak Republic
81.3
23031
36
77.3
19548
7
49
Slovenia
81.4
26170
8.
40
Sweden
82.6
51242
10.9
11
Switzerland
83.2
83717
12.3
14
Turkey
77.4
28242
4.2
58
United Kingdom
82.3
41030
9.6
19
Expert Solution
This question has been solved!
Explore an expertly crafted, step-by-step solution for a thorough understanding of key concepts.

This is a popular solution!

Trending now
This is a popular solution!

Step by step
Solved in 6 steps with 5 images

Recommended textbooks for you
MATLAB: An Introduction with Applications
Statistics
ISBN:
9781119256830
Author:
Amos Gilat
Publisher:
John Wiley & Sons Inc

Probability and Statistics for Engineering and th…
Statistics
ISBN:
9781305251809
Author:
Jay L. Devore
Publisher:
Cengage Learning

Statistics for The Behavioral Sciences (MindTap C…
Statistics
ISBN:
9781305504912
Author:
Frederick J Gravetter, Larry B. Wallnau
Publisher:
Cengage Learning
MATLAB: An Introduction with Applications
Statistics
ISBN:
9781119256830
Author:
Amos Gilat
Publisher:
John Wiley & Sons Inc
Probability and Statistics for Engineering and th…
Statistics
ISBN:
9781305251809
Author:
Jay L. Devore
Publisher:
Cengage Learning
Statistics for The Behavioral Sciences (MindTap C…
Statistics
ISBN:
9781305504912
Author:
Frederick J Gravetter, Larry B. Wallnau
Publisher:
Cengage Learning

Elementary Statistics: Picturing the World (7th E…
Statistics
ISBN:
9780134683416
Author:
Ron Larson, Betsy Farber
Publisher:
PEARSON

The Basic Practice of Statistics
Statistics
ISBN:
9781319042578
Author:
David S. Moore, William I. Notz, Michael A. Fligner
Publisher:
W. H. Freeman

Introduction to the Practice of Statistics
Statistics
ISBN:
9781319013387
Author:
David S. Moore, George P. McCabe, Bruce A. Craig
Publisher:
W. H. Freeman