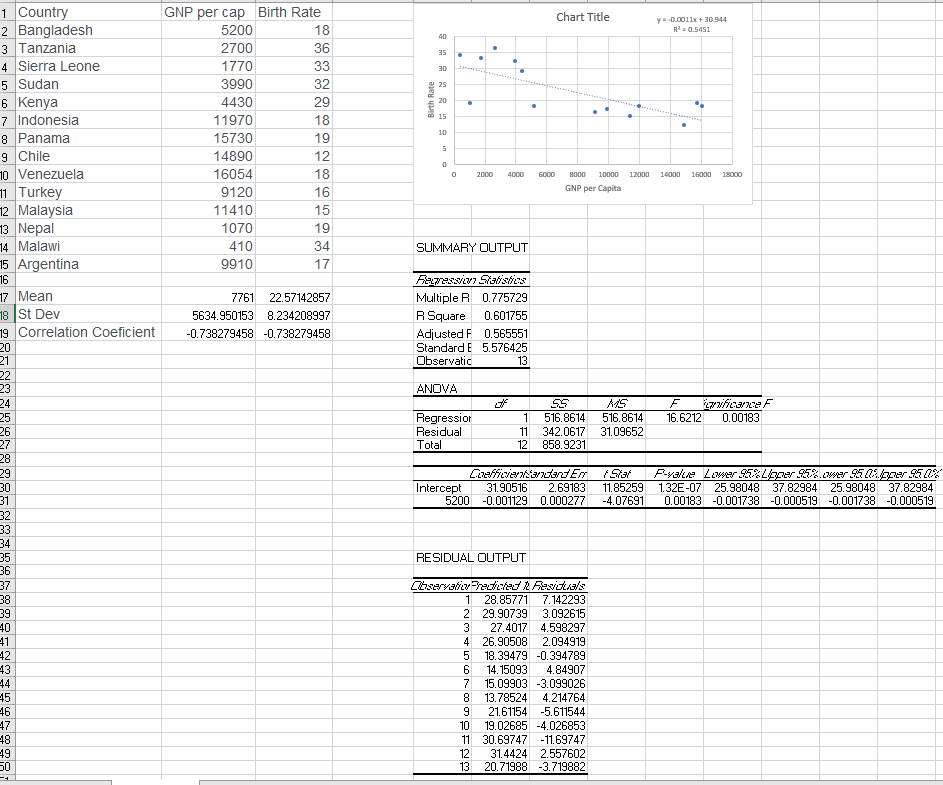
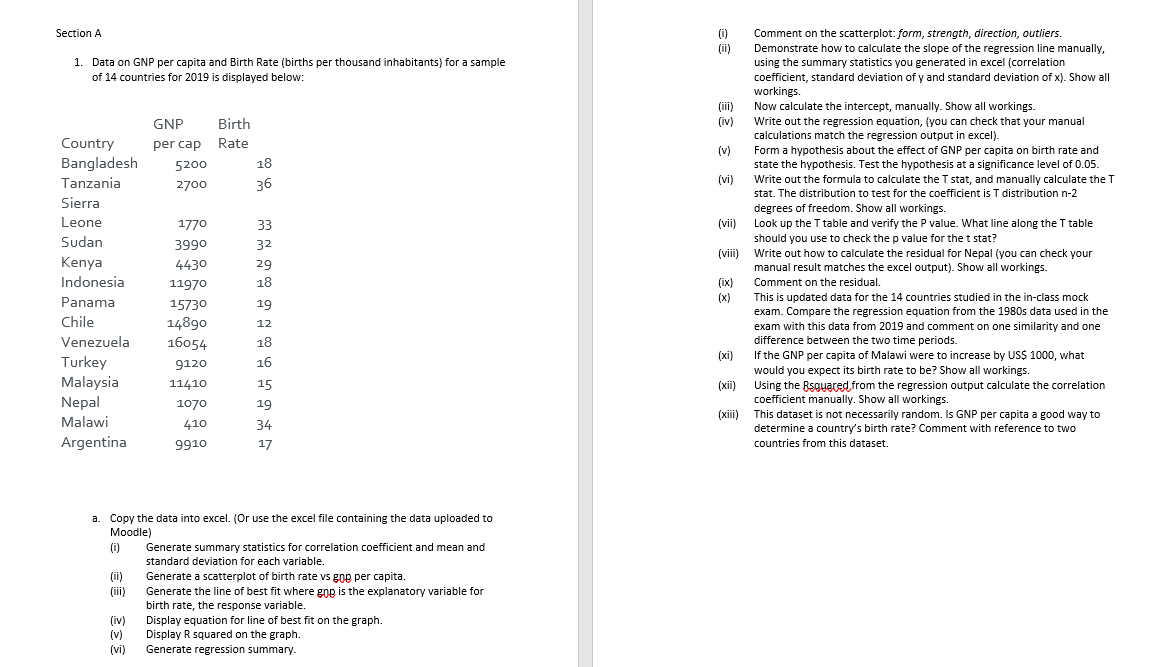
(iv) Write out the regression equation, (you can check that your manual calculations match the regression output in excel). (v) Form a hypothesis about the effect of GNP per capita on birth rate and state the hypothesis. Test the hypothesis at a significance level of 0.05. (vi)Write out the formula to calculate the T stat, and manually calculate the T stat. The distribution to test for the coefficient is T distribution n-2 degrees of freedom. Show all workings manually, using the summary statistics you generated in excel (correlation coefficient, standard deviation of y and standard deviation of x). Show all workings.


Correlation
Correlation defines a relationship between two independent variables. It tells the degree to which variables move in relation to each other. When two sets of data are related to each other, there is a correlation between them.
Linear Correlation
A correlation is used to determine the relationships between numerical and categorical variables. In other words, it is an indicator of how things are connected to one another. The correlation analysis is the study of how variables are related.
Regression Analysis
Regression analysis is a statistical method in which it estimates the relationship between a dependent variable and one or more independent variable. In simple terms dependent variable is called as outcome variable and independent variable is called as predictors. Regression analysis is one of the methods to find the trends in data. The independent variable used in Regression analysis is named Predictor variable. It offers data of an associated dependent variable regarding a particular outcome.
Good Afternoon
I have completed the requested questions on section 1 a on excel however I am having a bit of trouble analysing this data and awnsering 1 b and it's sub questions.
please help me solve these 3 sub questions
- (iv) Write out the regression equation, (you can check that your manual calculations match the regression output in excel).
- (v) Form a hypothesis about the effect of GNP per capita on birth rate and state the hypothesis. Test the hypothesis at a significance level of 0.05.
- (vi)Write out the formula to calculate the T stat, and manually calculate the T stat. The distribution to test for the coefficient is T distribution n-2 degrees of freedom. Show all workings manually, using the summary statistics you generated in excel (
correlation coefficient , standard deviation of y and standard deviation of x). Show all workings.
The comment must be done on the work I have already done on excel.
Please help,thank you.

Step by step
Solved in 3 steps


