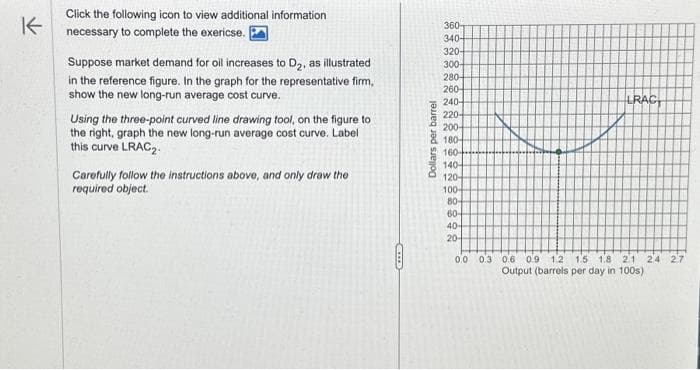
K Click the following icon to view additional information necessary to complete the exericse. Suppose market demand for oil increases to D₂, as illustrated in the reference figure. In the graph for the representative firm, show the new long-run average cost curve. Using the three-point curved line drawing tool, on the figure to the right, graph the new long-run average cost curve. Label this curve LRAC₂. Carefully follow the instructions above, and only draw the required object. CIS Dollars per barrel 360- 340- 320- 300- 280+ 260- 240- 220- 200- 180- 160- 140- 120- 100+ 80- 60- 40- 20- LRAC 0.0 0.3 0.6 0.9 1.2 1.5 1.8 2.1 24 27 Output (barrels per day in 100s)
K Click the following icon to view additional information necessary to complete the exericse. Suppose market demand for oil increases to D₂, as illustrated in the reference figure. In the graph for the representative firm, show the new long-run average cost curve. Using the three-point curved line drawing tool, on the figure to the right, graph the new long-run average cost curve. Label this curve LRAC₂. Carefully follow the instructions above, and only draw the required object. CIS Dollars per barrel 360- 340- 320- 300- 280+ 260- 240- 220- 200- 180- 160- 140- 120- 100+ 80- 60- 40- 20- LRAC 0.0 0.3 0.6 0.9 1.2 1.5 1.8 2.1 24 27 Output (barrels per day in 100s)

Principles of Economics (MindTap Course List)
8th Edition
ISBN:9781305585126
Author:N. Gregory Mankiw
Publisher:N. Gregory Mankiw
Chapter14: Firms In Competitive Markets
Section: Chapter Questions
Problem 4PA

Related questions
Question
Economics
Note:-
- Do not provide handwritten solution. Maintain accuracy and quality in your answer. Take care of plagiarism.
- Do not provide Excel Screet shot rather use tool table
- Answer completely.

Transcribed Image Text:6
7
8
Figure
The figure to the right shows the initial
market supply (S₁) and market
demand (D₁) curves for the oil industry
along with the industry's long-run
supply curve (S₁).
Movement up along the long-run
industry supply curve is indicated by
the rightward shift in demand to D₂.
Dollars per barrel
360-
340-
320-
300-
280-
260-
240-
220-
200-
180-
160
140-
120-
100-
80-
60-
40-
20-
Print
0.0
S.
D.
Done
0₂
0.4 0.8 1.2 1.6 2.0 2,4
Output (barrels per day in 10,000s)
2.8
Q
Q
5
-
X
1.5
per
Transcribed Image Text:K
Click the following icon to view additional information
necessary to complete the exericse.
Suppose market demand for oil increases to D₂, as illustrated
in the reference figure. In the graph for the representative firm,
show the new long-run average cost curve.
Using the three-point curved line drawing tool, on the figure to
the right, graph the new long-run average cost curve. Label
this curve LRAC₂.
Carefully follow the instructions above, and only draw the
required object.
GIED
Dollars per barrel
360-
340-
320-
300
280-
260-
240-
220-
200-
180-
160-
140-
120-
100-
80-
60-
40-
20
LRAC!
0.0 0.3 0.6 0.9 1.2 1.5 1.8 2.1 24 27
Output (barrels per day in 100s)
Expert Solution
This question has been solved!
Explore an expertly crafted, step-by-step solution for a thorough understanding of key concepts.

This is a popular solution!

Trending now
This is a popular solution!

Step by step
Solved in 3 steps with 1 images

Knowledge Booster


Learn more about
Need a deep-dive on the concept behind this application? Look no further. Learn more about this topic, economics and related others by exploring similar questions and additional content below.Recommended textbooks for you
Principles of Economics (MindTap Course List)
Economics
ISBN:
9781305585126
Author:
N. Gregory Mankiw
Publisher:
Cengage Learning

Principles of Economics, 7th Edition (MindTap Cou…
Economics
ISBN:
9781285165875
Author:
N. Gregory Mankiw
Publisher:
Cengage Learning

Essentials of Economics (MindTap Course List)
Economics
ISBN:
9781337091992
Author:
N. Gregory Mankiw
Publisher:
Cengage Learning
Principles of Economics (MindTap Course List)
Economics
ISBN:
9781305585126
Author:
N. Gregory Mankiw
Publisher:
Cengage Learning
Principles of Economics, 7th Edition (MindTap Cou…
Economics
ISBN:
9781285165875
Author:
N. Gregory Mankiw
Publisher:
Cengage Learning
Essentials of Economics (MindTap Course List)
Economics
ISBN:
9781337091992
Author:
N. Gregory Mankiw
Publisher:
Cengage Learning

Principles of Economics 2e
Economics
ISBN:
9781947172364
Author:
Steven A. Greenlaw; David Shapiro
Publisher:
OpenStax

Exploring Economics
Economics
ISBN:
9781544336329
Author:
Robert L. Sexton
Publisher:
SAGE Publications, Inc
