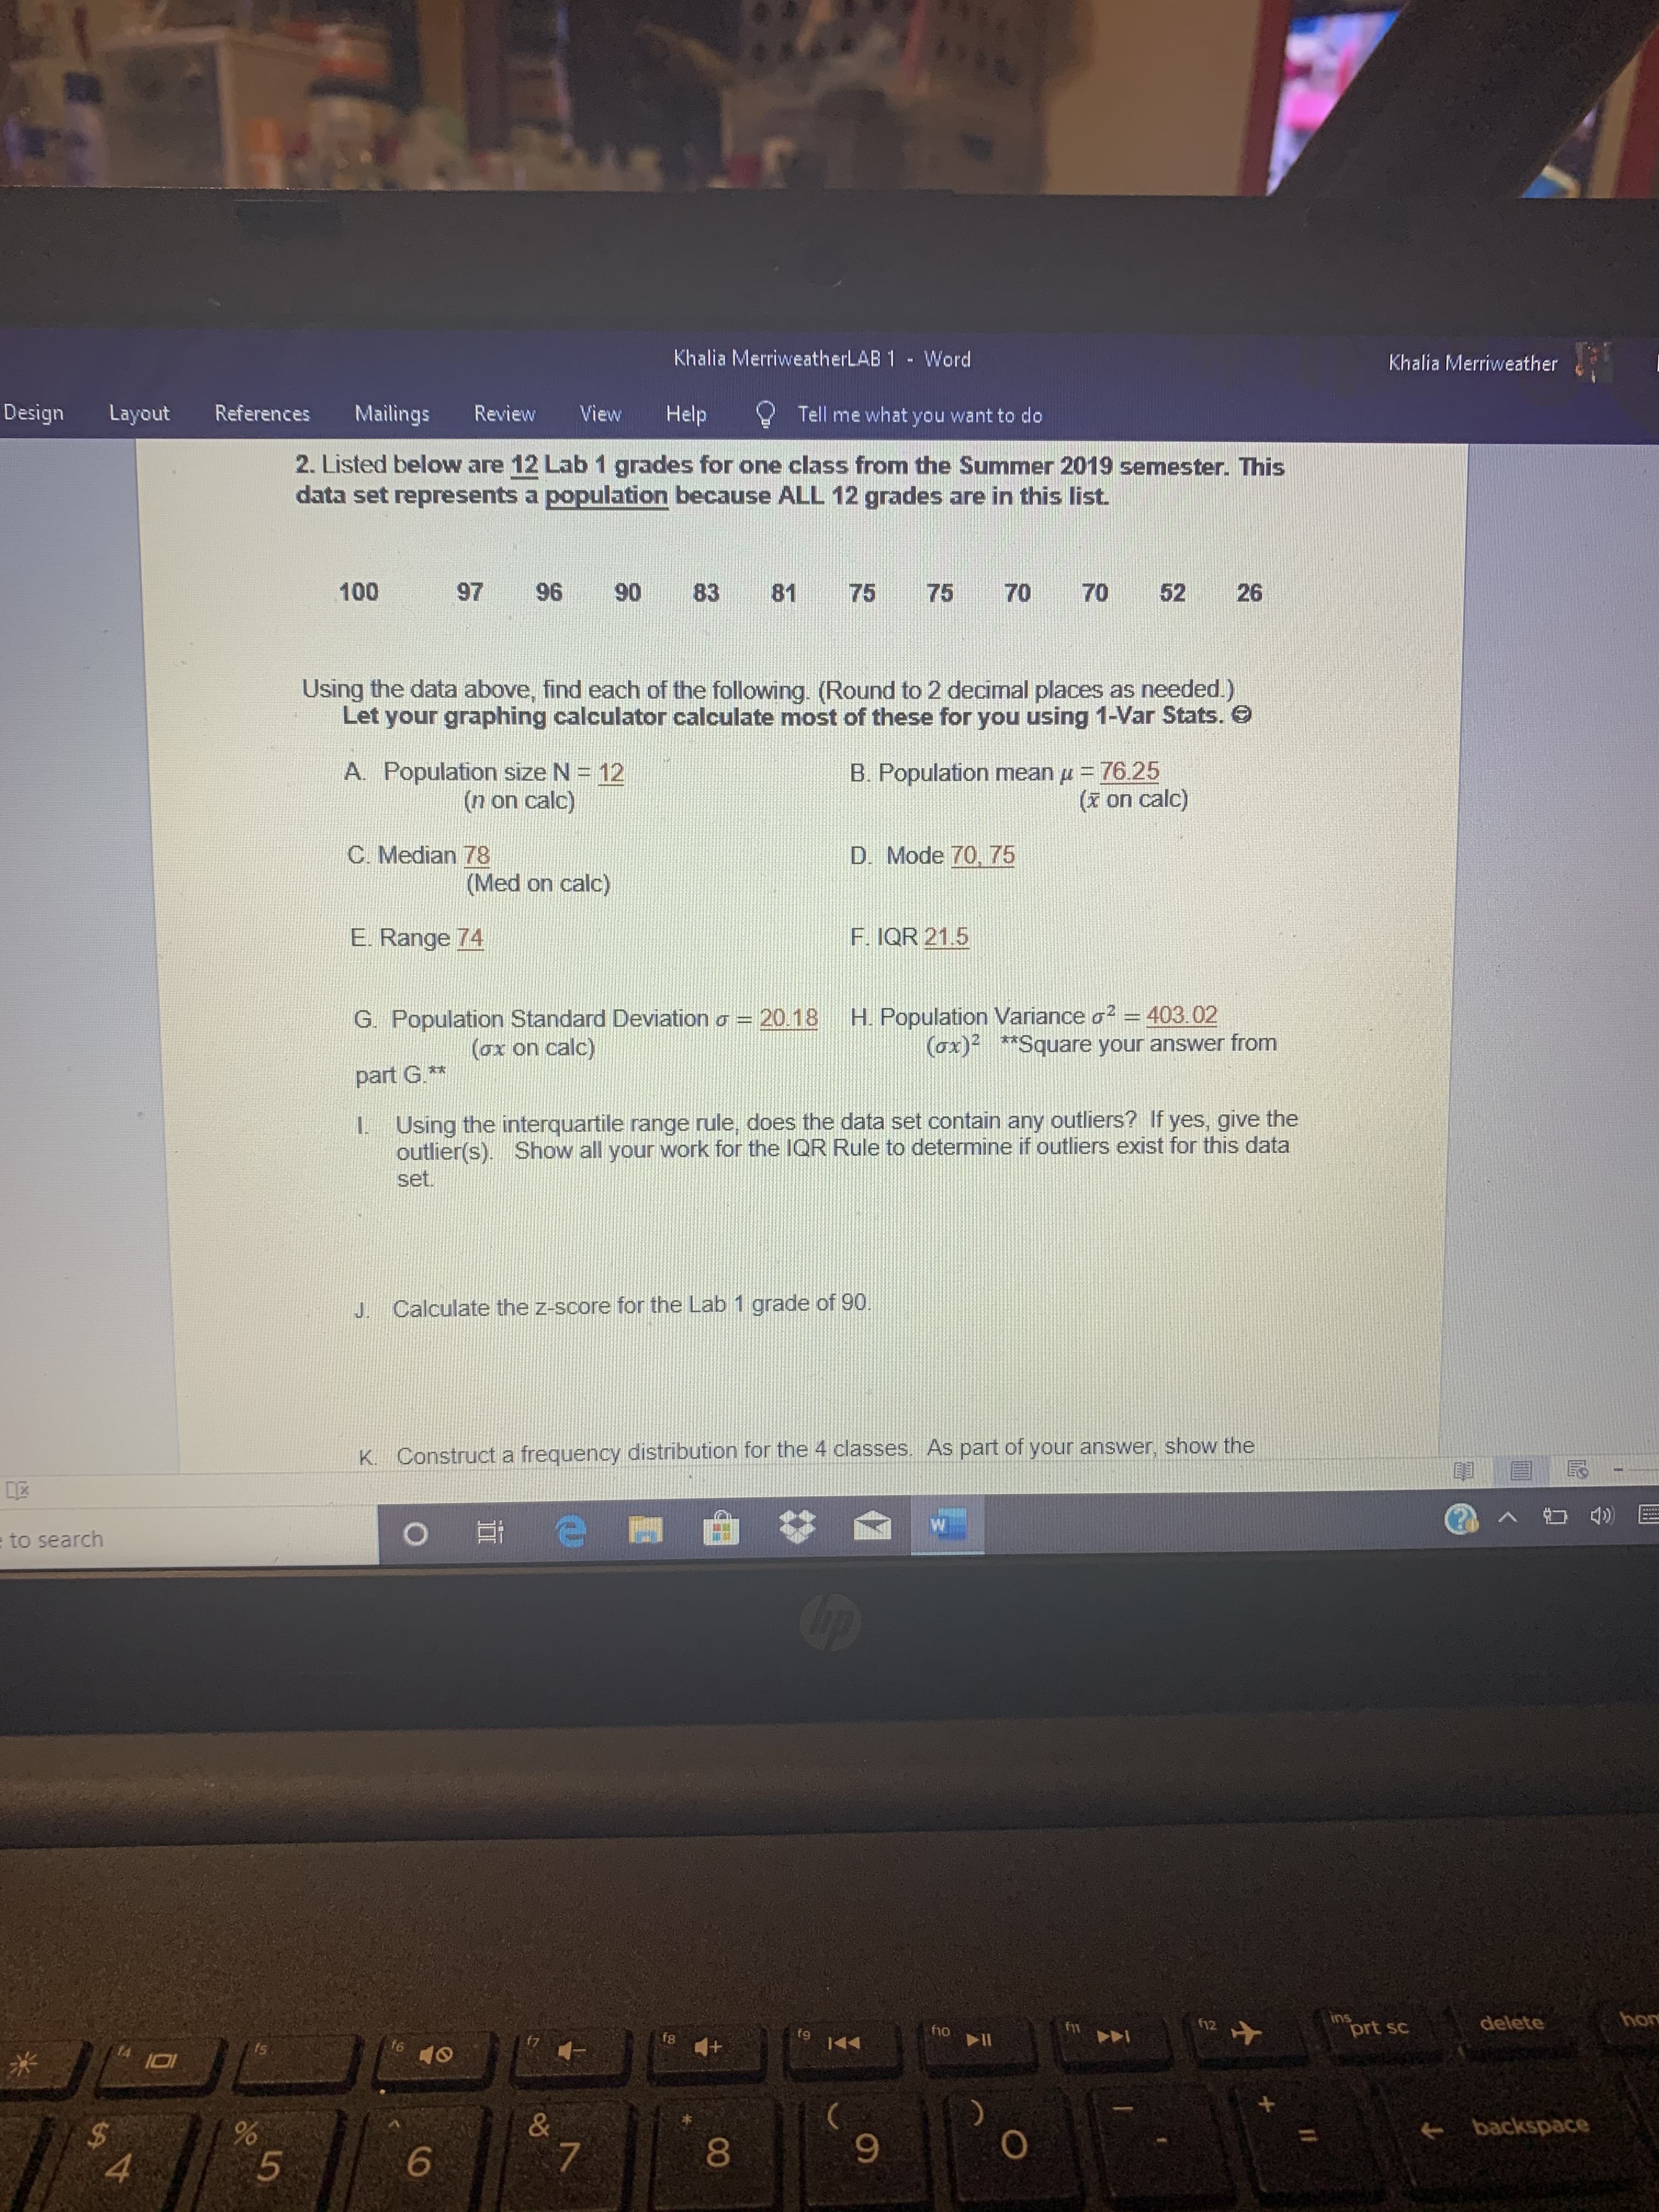
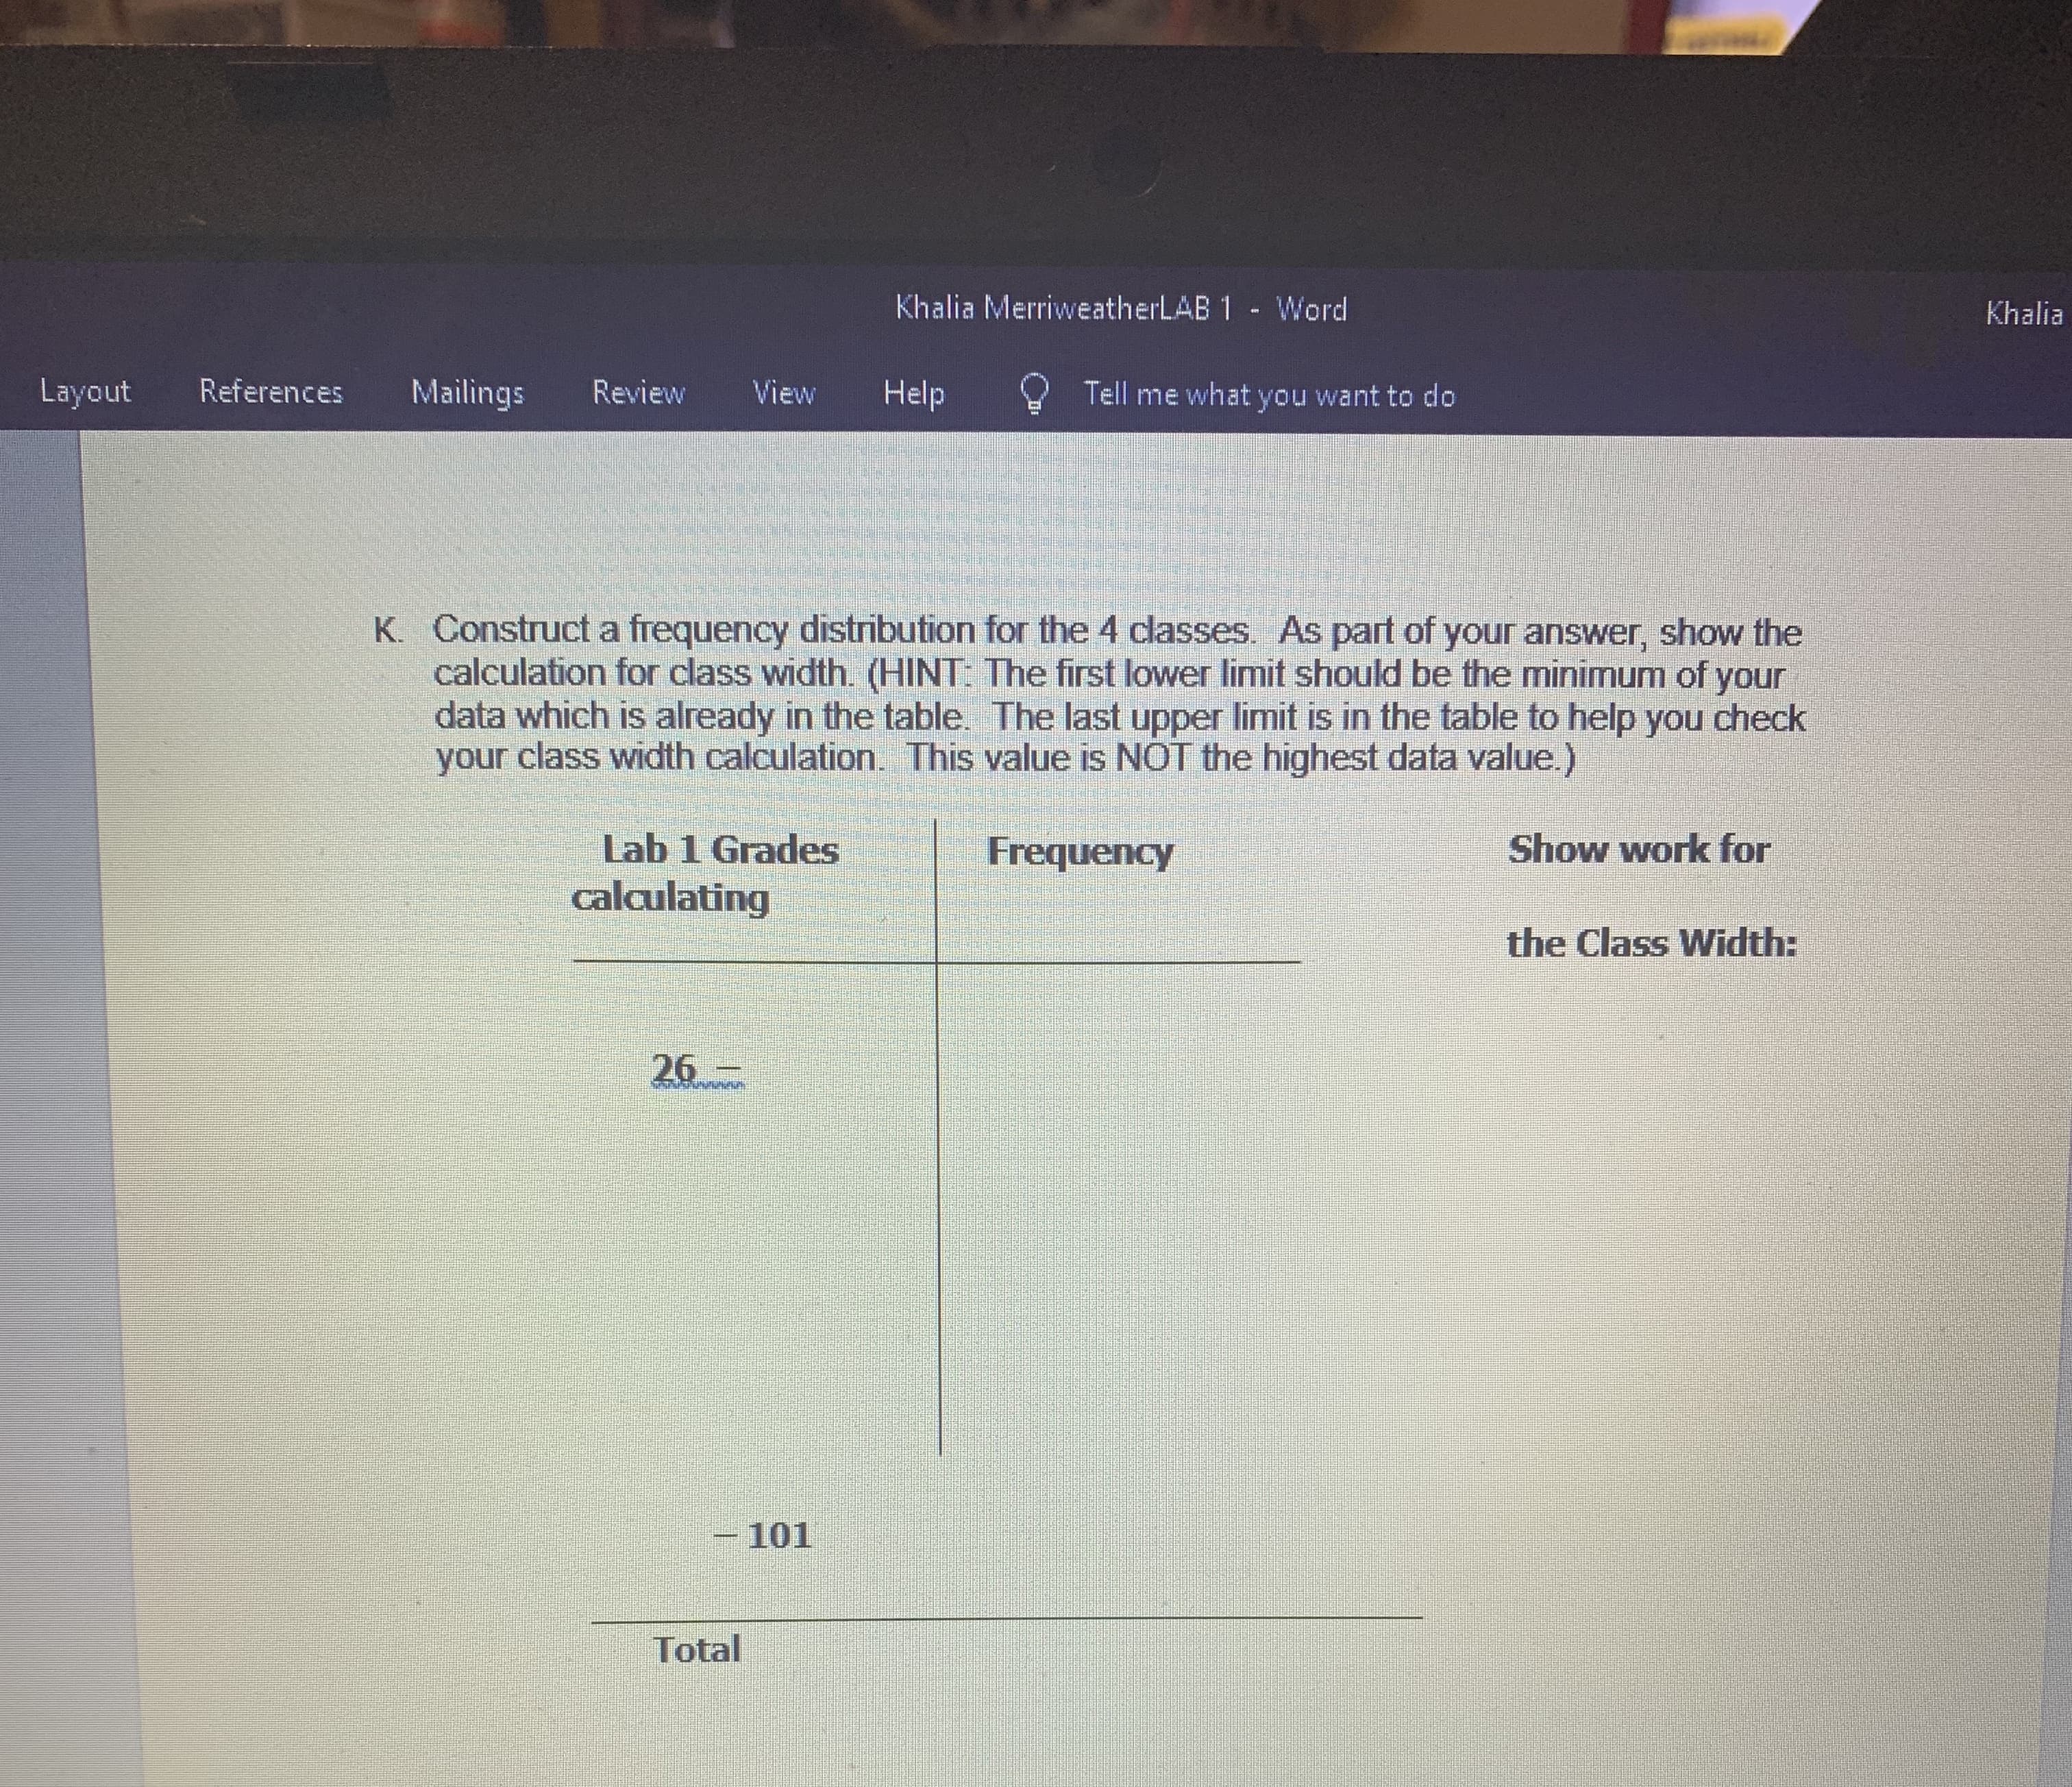
Khalia MerriweatherLAB 1 - Word Khalia Merriweather Design Layout References Mailings Review View Help Tell me what you want to do 2. Listed below are 12 Lab 1 grades for one class from the Summer 2019 semester. This data set represents a population because ALL 12 grades are in this list. 100 97 96 90 83 81 75 75 70 70 52 26 Using the data above, find each of the following. (Round to 2 decimal places as needed.) Let your graphing calculator calculate most of these for you using 1-Var Stats. O A. Population size N = 12 (n on calc) B. Population mean u = 76.25 (x on calc) C. Median 7 D. Mode 70, 75 (Med on calc) E. Range 74 F. IQR 21.5 G. Population Standard Deviation o = 20.18 (ox on calc) H. Population Variance o2 = 403.02 (ox)**Square your answer from part G.** I Using the interquartile range rule, does the data set contain any outliers? If yes, give the outlier(s). Show all your work for the IQR Rule to determine if outliers exist for this data set. J. Calculate the z-score for the Lab 1 grade of 90. K. Construct a frequency distribution for the 4 classes. As part of your answer, show the PRCOER e to search ins delete hom 12 fio II prt sc f8 14 f5 f6 144 %24 e backspace 9. Khalia MerriweatherLAB 1 - Word Khalia Layout References Mailings Review View Help Tell me what you want to do K. Constructa frequency distribution for the 4 classes. As part of your answer, show the calculation for class width. (HINT: The first lower limit should be the minimum of your data which is already in the table. The last upper limit is in the table to help you your class width calculation. This value is NOT the highest data value.) check Show work for Lab 1 Grades calculating Frequency the Class Width: 26 - 101 Total


Inverse Normal Distribution
The method used for finding the corresponding z-critical value in a normal distribution using the known probability is said to be an inverse normal distribution. The inverse normal distribution is a continuous probability distribution with a family of two parameters.
Mean, Median, Mode
It is a descriptive summary of a data set. It can be defined by using some of the measures. The central tendencies do not provide information regarding individual data from the dataset. However, they give a summary of the data set. The central tendency or measure of central tendency is a central or typical value for a probability distribution.
Z-Scores
A z-score is a unit of measurement used in statistics to describe the position of a raw score in terms of its distance from the mean, measured with reference to standard deviation from the mean. Z-scores are useful in statistics because they allow comparison between two scores that belong to different normal distributions.
I. Using the
J. Calculate the z-score for the Lab 1 grade of 90.
K. Construct a frequency distribution for the 4 classes. As part of your answer, show the calculation for class width.


Trending now
This is a popular solution!

Step by step
Solved in 7 steps with 5 images


