Last year a company received 50 complaints concerning carpet installation. The data in the accompanying table represents the number of days between the receipt of a complaint and the resolution of the complaint. a. The supervisor claims that the mean number of days between the receipt of a complaint and the resolution of the complaint is 20 days. At the 0.10 level of significance, is there evidence that the claim is not true (that is, that the mean number of days is different from 20)? State the null and alternative hypotheses.
Last year a company received 50 complaints concerning carpet installation. The data in the accompanying table represents the number of days between the receipt of a complaint and the resolution of the complaint. a. The supervisor claims that the mean number of days between the receipt of a complaint and the resolution of the complaint is 20 days. At the 0.10 level of significance, is there evidence that the claim is not true (that is, that the mean number of days is different from 20)? State the null and alternative hypotheses.

Big Ideas Math A Bridge To Success Algebra 1: Student Edition 2015
1st Edition
ISBN:9781680331141
Author:HOUGHTON MIFFLIN HARCOURT
Publisher:HOUGHTON MIFFLIN HARCOURT
Chapter11: Data Analysis And Displays
Section: Chapter Questions
Problem 6CR

Related questions
Topic Video
Question
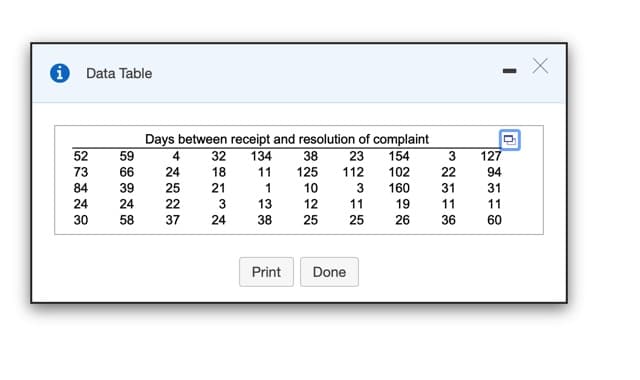
Last year a company received 50 complaints concerning carpet installation. The data in the accompanying table represents the number of days between the receipt of a complaint and the resolution of the complaint.
a. The supervisor claims that the mean number of days between the receipt of a complaint and the resolution of the complaint is 20 days. At the 0.10
level of significance, is there evidence that the claim is not true (that is, that the mean number of days is different from 20)?
level of significance, is there evidence that the claim is not true (that is, that the mean number of days is different from 20)?
State the null and alternative hypotheses.
Transcribed Image Text:i Data Table
Days between receipt and resolution of complaint
134
52
59
4
32
38
154
127
23
112
3
125
102
160
73
66
24
18
11
22
94
84
39
25
21
1
10
3
31
31
24
24
22
3
13
38
12
11
19
11
11
30
58
37
24
25
25
26
36
60
Print
Done
Expert Solution
Step 1
One-Sample T-Test:
It is the hypothesis testing done for comparing the mean of the data to a specific value. As the name says it is one-sample t-test, the data of one sample is considered for the complete hypothesis testing and the test statistics will be found from that data.

Trending now
This is a popular solution!

Step by step
Solved in 3 steps

Knowledge Booster


Learn more about
Need a deep-dive on the concept behind this application? Look no further. Learn more about this topic, statistics and related others by exploring similar questions and additional content below.Recommended textbooks for you
Big Ideas Math A Bridge To Success Algebra 1: Stu…
Algebra
ISBN:
9781680331141
Author:
HOUGHTON MIFFLIN HARCOURT
Publisher:
Houghton Mifflin Harcourt

Holt Mcdougal Larson Pre-algebra: Student Edition…
Algebra
ISBN:
9780547587776
Author:
HOLT MCDOUGAL
Publisher:
HOLT MCDOUGAL

College Algebra (MindTap Course List)
Algebra
ISBN:
9781305652231
Author:
R. David Gustafson, Jeff Hughes
Publisher:
Cengage Learning
Big Ideas Math A Bridge To Success Algebra 1: Stu…
Algebra
ISBN:
9781680331141
Author:
HOUGHTON MIFFLIN HARCOURT
Publisher:
Houghton Mifflin Harcourt
Holt Mcdougal Larson Pre-algebra: Student Edition…
Algebra
ISBN:
9780547587776
Author:
HOLT MCDOUGAL
Publisher:
HOLT MCDOUGAL
College Algebra (MindTap Course List)
Algebra
ISBN:
9781305652231
Author:
R. David Gustafson, Jeff Hughes
Publisher:
Cengage Learning

Glencoe Algebra 1, Student Edition, 9780079039897…
Algebra
ISBN:
9780079039897
Author:
Carter
Publisher:
McGraw Hill