lenovo s for E X 1/cfi/519!/4/4@0.00:57.3 to Atlanta and Houston. The file named Hotel contains samples of prices for in Atlanta and Houston that are consistent with a SmartMoney survey conducted by Smith Travel Research. Because considerable historical data on the prices of rooms in both cities are available, the population standard deviations for the prices can be assumed to be $20 in Atlanta and $25 in Houston. Based on the sample data, can you conclude that the mean price of a hotel room in Atlanta is lower than one in Houston? 7. Supermarket Customer Satisfaction. Consumer Reports uses a survey of readers to obtain customer satisfaction ratings for the nation's largest supermarkets (Consumer Reports, https://www.consumerreports.org/products/grocery-stores-supermarkets/ratings-overview/). Each survey respondent is asked to rate a specified supermarket based on a variety of factors such as: quality of products, selection, value, checkout efficiency, service, and store layout. An overall satisfaction score summarizes the rating for each respondent with 100 meaning the respondent is completely satisfied in terms of all factors. Sample data representative of independent samples of Publix and Trader Joe's customers are shown below. Trader Joe's Publix n2 = 300 n=250 X2 = 85 X, = 86 a. Formulate the null and alternative hypotheses to test whether there is a difference between the population mean customer satisfaction scores for the two retailers. We've updated our Glve it a 2020 Cengage Learning. All Rights Reserved. May not be copied, scanned, or duplicated, in whole or in part. WCN 02-200-202 ning. All Rights Reserved. May not be copied, scanned, or duplicated, in whole or in part. Due to electronic rights, some third party content may be suppressed from the eBook and ny suppressed content does not materially affect the overall learning experience. Cengage Learning reserves the right to remove additional content at any time if subsequent rights 1 SAa a. Formulate the null and alternative hypotheses to test whether there is a difference between the population mean customer satisfaction scores for the two retailers b. Assume that experience with the Consumer Reports satisfaction rating scale indicates that a population standard deviation of 12 is a reasonable assumption for both retailers. Conduct the hypothesis test and report the p-value. At a .05 level of significance what is c. Which retailer, if either, appears to have conclusion? your the greater customer satisfaction? Provide a 95% confidence interval for the difference between the population mean customer satisfaction scores for the two retailers
lenovo s for E X 1/cfi/519!/4/4@0.00:57.3 to Atlanta and Houston. The file named Hotel contains samples of prices for in Atlanta and Houston that are consistent with a SmartMoney survey conducted by Smith Travel Research. Because considerable historical data on the prices of rooms in both cities are available, the population standard deviations for the prices can be assumed to be $20 in Atlanta and $25 in Houston. Based on the sample data, can you conclude that the mean price of a hotel room in Atlanta is lower than one in Houston? 7. Supermarket Customer Satisfaction. Consumer Reports uses a survey of readers to obtain customer satisfaction ratings for the nation's largest supermarkets (Consumer Reports, https://www.consumerreports.org/products/grocery-stores-supermarkets/ratings-overview/). Each survey respondent is asked to rate a specified supermarket based on a variety of factors such as: quality of products, selection, value, checkout efficiency, service, and store layout. An overall satisfaction score summarizes the rating for each respondent with 100 meaning the respondent is completely satisfied in terms of all factors. Sample data representative of independent samples of Publix and Trader Joe's customers are shown below. Trader Joe's Publix n2 = 300 n=250 X2 = 85 X, = 86 a. Formulate the null and alternative hypotheses to test whether there is a difference between the population mean customer satisfaction scores for the two retailers. We've updated our Glve it a 2020 Cengage Learning. All Rights Reserved. May not be copied, scanned, or duplicated, in whole or in part. WCN 02-200-202 ning. All Rights Reserved. May not be copied, scanned, or duplicated, in whole or in part. Due to electronic rights, some third party content may be suppressed from the eBook and ny suppressed content does not materially affect the overall learning experience. Cengage Learning reserves the right to remove additional content at any time if subsequent rights 1 SAa a. Formulate the null and alternative hypotheses to test whether there is a difference between the population mean customer satisfaction scores for the two retailers b. Assume that experience with the Consumer Reports satisfaction rating scale indicates that a population standard deviation of 12 is a reasonable assumption for both retailers. Conduct the hypothesis test and report the p-value. At a .05 level of significance what is c. Which retailer, if either, appears to have conclusion? your the greater customer satisfaction? Provide a 95% confidence interval for the difference between the population mean customer satisfaction scores for the two retailers

MATLAB: An Introduction with Applications
6th Edition
ISBN:9781119256830
Author:Amos Gilat
Publisher:Amos Gilat
Chapter1: Starting With Matlab
Section: Chapter Questions
Problem 1P

Related questions

Concept explainers
Contingency Table
A contingency table can be defined as the visual representation of the relationship between two or more categorical variables that can be evaluated and registered. It is a categorical version of the scatterplot, which is used to investigate the linear relationship between two variables. A contingency table is indeed a type of frequency distribution table that displays two variables at the same time.
Binomial Distribution
Binomial is an algebraic expression of the sum or the difference of two terms. Before knowing about binomial distribution, we must know about the binomial theorem.
Topic Video
Question
Problem 7 A-C
Transcribed Image Text:lenovo
s for E X
1/cfi/519!/4/4@0.00:57.3
to Atlanta and Houston. The file named Hotel contains samples of prices for
in Atlanta and Houston that are consistent with a SmartMoney survey conducted by
Smith Travel Research. Because considerable historical data on the prices of rooms
in both cities are available, the population standard deviations for the prices can be
assumed to be $20 in Atlanta and $25 in Houston. Based on the sample data, can you
conclude that the mean price of a hotel room in Atlanta is lower than one in Houston?
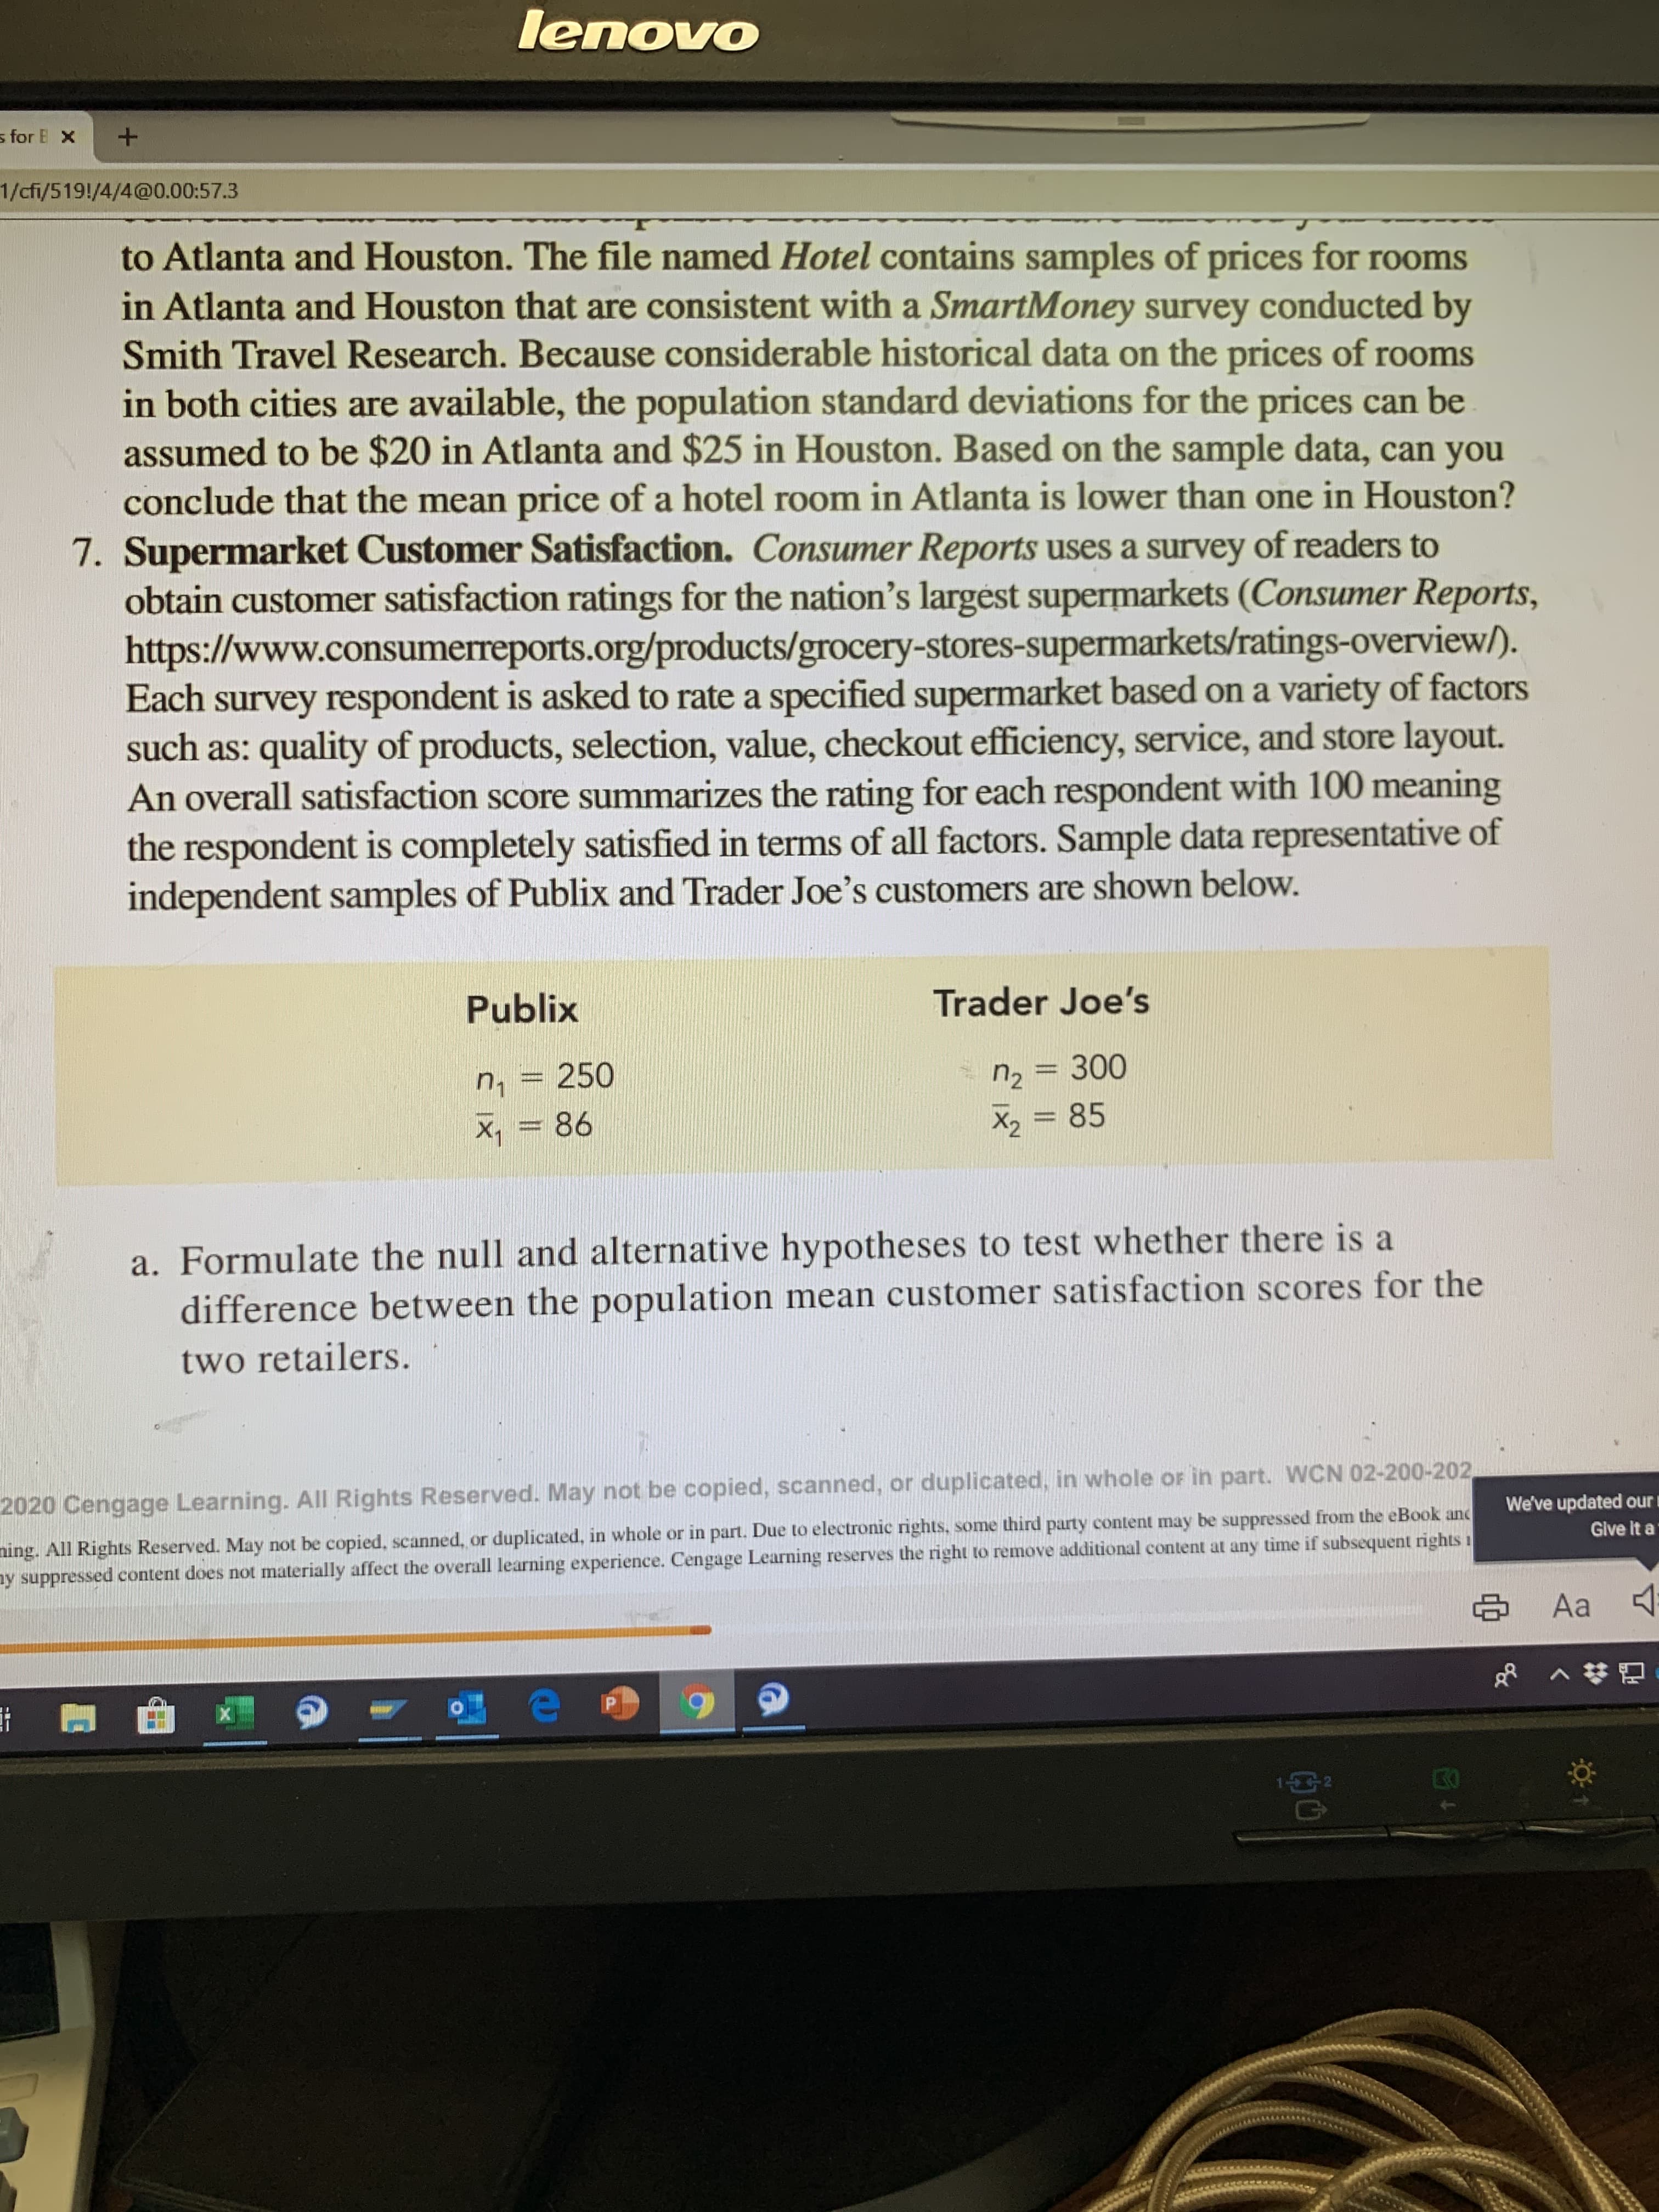
7. Supermarket Customer Satisfaction. Consumer Reports uses a survey of readers to
obtain customer satisfaction ratings for the nation's largest supermarkets (Consumer Reports,
https://www.consumerreports.org/products/grocery-stores-supermarkets/ratings-overview/).
Each survey respondent is asked to rate a specified supermarket based on a variety of factors
such as: quality of products, selection, value, checkout efficiency, service, and store layout.
An overall satisfaction score summarizes the rating for each respondent with 100 meaning
the respondent is completely satisfied in terms of all factors. Sample data representative of
independent samples of Publix and Trader Joe's customers are shown below.
Trader Joe's
Publix
n2 = 300
n=250
X2 = 85
X, = 86
a. Formulate the null and alternative hypotheses to test whether there is a
difference between the population mean customer satisfaction scores for the
two retailers.
We've updated our
Glve it a
2020 Cengage Learning. All Rights Reserved. May not be copied, scanned, or duplicated, in whole or in part. WCN 02-200-202
ning. All Rights Reserved. May not be copied, scanned, or duplicated, in whole or in part. Due to electronic rights, some third party content may be suppressed from the eBook and
ny suppressed content does not materially affect the overall learning experience. Cengage Learning reserves the right to remove additional content at any time if subsequent rights 1
SAa
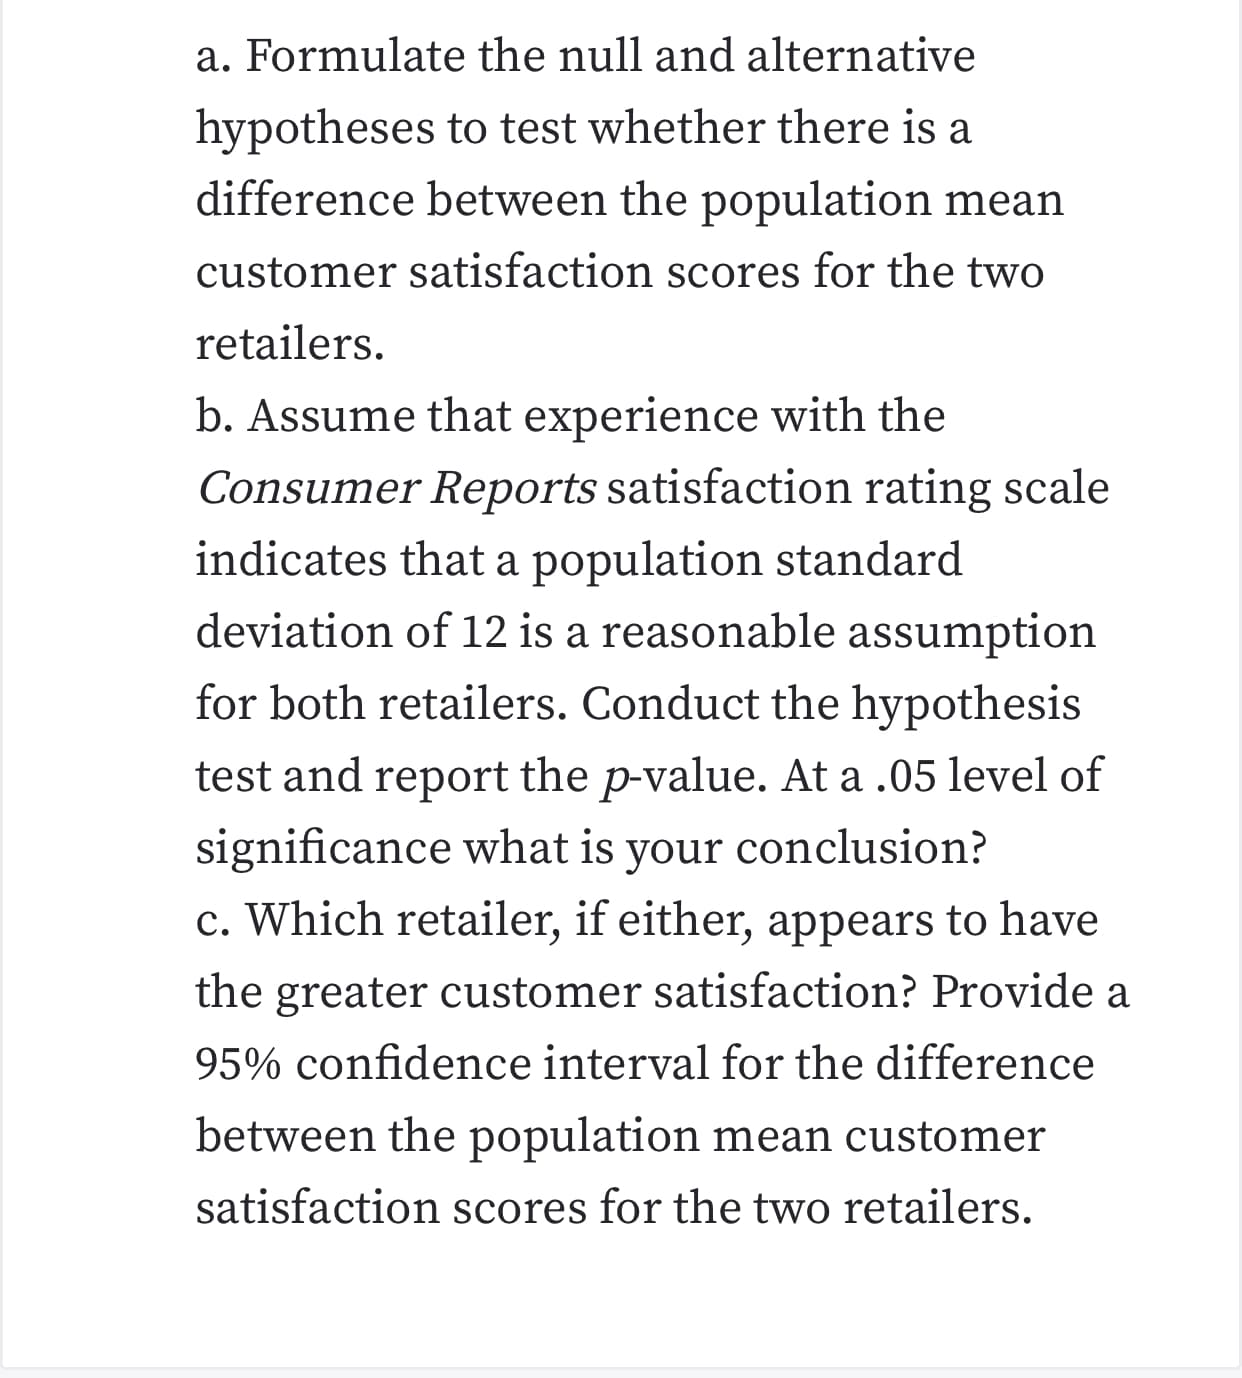
Transcribed Image Text:a. Formulate the null and alternative
hypotheses to test whether there is a
difference between the population mean
customer satisfaction scores for the two
retailers
b. Assume that experience with the
Consumer Reports satisfaction rating scale
indicates that a population standard
deviation of 12 is a reasonable assumption
for both retailers. Conduct the hypothesis
test and report the p-value. At a .05 level of
significance what is
c. Which retailer, if either, appears to have
conclusion?
your
the greater customer satisfaction? Provide a
95% confidence interval for the difference
between the population mean customer
satisfaction scores for the two retailers
Expert Solution
This question has been solved!
Explore an expertly crafted, step-by-step solution for a thorough understanding of key concepts.

This is a popular solution!

Trending now
This is a popular solution!

Step by step
Solved in 5 steps with 5 images

Knowledge Booster


Learn more about
Need a deep-dive on the concept behind this application? Look no further. Learn more about this topic, statistics and related others by exploring similar questions and additional content below.Recommended textbooks for you
MATLAB: An Introduction with Applications
Statistics
ISBN:
9781119256830
Author:
Amos Gilat
Publisher:
John Wiley & Sons Inc

Probability and Statistics for Engineering and th…
Statistics
ISBN:
9781305251809
Author:
Jay L. Devore
Publisher:
Cengage Learning

Statistics for The Behavioral Sciences (MindTap C…
Statistics
ISBN:
9781305504912
Author:
Frederick J Gravetter, Larry B. Wallnau
Publisher:
Cengage Learning
MATLAB: An Introduction with Applications
Statistics
ISBN:
9781119256830
Author:
Amos Gilat
Publisher:
John Wiley & Sons Inc
Probability and Statistics for Engineering and th…
Statistics
ISBN:
9781305251809
Author:
Jay L. Devore
Publisher:
Cengage Learning
Statistics for The Behavioral Sciences (MindTap C…
Statistics
ISBN:
9781305504912
Author:
Frederick J Gravetter, Larry B. Wallnau
Publisher:
Cengage Learning

Elementary Statistics: Picturing the World (7th E…
Statistics
ISBN:
9780134683416
Author:
Ron Larson, Betsy Farber
Publisher:
PEARSON

The Basic Practice of Statistics
Statistics
ISBN:
9781319042578
Author:
David S. Moore, William I. Notz, Michael A. Fligner
Publisher:
W. H. Freeman

Introduction to the Practice of Statistics
Statistics
ISBN:
9781319013387
Author:
David S. Moore, George P. McCabe, Bruce A. Craig
Publisher:
W. H. Freeman