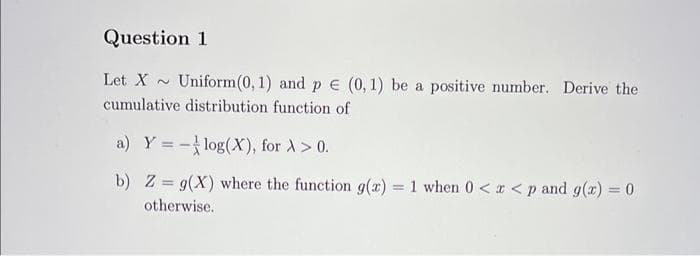
Let X~ Uniform(0, 1) and pe (0, 1) be a positive number. Derive the cumulative distribution function of a) Y = -log(X), for >> 0. b) Z= g(X) where the function g(x) = 1 when 0 < x


Q: 4. These data shows a historically important study of water fluoridation (ppm) and dental caries…
A: Given information: A scatterplot and residual plot are given.
Q: A weighted dice satisfies the following probability distribution: p(1) = p(5), 4.p(3) = p(2), and…
A: To solve this problem, we first need to determine the probability of rolling each number on the…
Q: %. of the military because they are too short or too tall? ght requirement is fairly small. ght…
A:
Q: at a certain school, 34% of the students will qualify for financial aid type A and 19% will qualify…
A: Given information: PA=0.34PB=0.19PA∩B=0.051
Q: How does the concept of conditional probability impact decision making in real-world scenarios, and…
A: Conditional probability can be used to calculate the probability of an event A occurring, given that…
Q: The testing times for a group of college students were normally distributed with a mean of μ = 33…
A: given data normal distributionμ = 33σ = 2 empirical rule : approximately 68-95-99.7% data fall…
Q: QUESTION 25 Which of the following would produce the widest confidence interval for µ? 97%…
A: The confidence levels and sample sizes are given.
Q: An experimental diet to induce weight loss was followed for one week by a randomly selected group of…
A: Given information: The data for weight loss for a group of 12 students are given.
Q: A sample has n = 16 scores, a mean of M = 45 and has an estimated standard error of 4 points (sM =…
A: Given information is A sample has n = 16 scores, a mean of M = 45 and has an estimated standard…
Q: The joint density function for a pair of random variables X and Y is given. (Round your answers to…
A: Given that: The joint density function of X an Y is: fx+y=Cx1+y if 0≤x≤5, 0≤y≤60…
Q: Given the normal distribution represented by X ~ N(81.8, 3.4). Find the 70th percentile to the…
A: Ans#- Given the normal distribution represented by X ~ N(81.8, 3.4). Find the 70th…
Q: Suppose that an airline uses a seat width of 16.8 in. Assume men have hip breadths that are normally…
A: given data normal distributionμ = 14.8σ = 0.9n = 115
Q: difference between two population means - Independent
A: *Answer: Given data Population standard deviations σ1=0.94andσ2=1.09 sample sizes…
Q: You want to test the speed of your internet connection. You will test the claim that your average…
A: given data claim : μ > 4.3 Mb/sn =39x¯ = 4.9 Mb/sσ = 1.1 Mb/s
Q: A particular fruit's weights are normally distributed, with a mean of 399 grams and a standard…
A: given data, normal distributionμ=399σ=32we have to find out the heaviest 6 % of fruits weight =?
Q: A student is to select three courses for next semester. If this student decides to…
A: Given that 7 economic courses, 9 mathematics courses, and 4 computer courses, We have to select 3…
Q: Complete a 6-step hypothesis test, using your friend's results, that the Oral-B 3D toothbrush…
A: Let μ be the mean no. of cavities in a student. Given that, No. of college students (n) = 21 Test…
Q: The graph illustrates a normal distribution for the prices paid for a particular model of HD…
A: given data normal distributionμ = 1000σ = 105
Q: In a study of government financial aid for college students, it becomes necessary to estimate the…
A: given data 95% confidence interval for p. E = 0.01n = ?
Q: Make pairwise comparisons of display panels A, B, and C by using Tukey simultaneous 95 percent…
A: Given information, A researcher conducted a study to compare three display panels used by air…
Q: Q13What is the correlation between average monthly rainfall and crop yield in a given region over…
A:
Q: Which statement accurately reflects qualitative and quantitative data? a.Height is qualitative and…
A:
Q: (Depreciation). Table 2 gives the market value of a luxury sedan (in dollars) x years after its…
A: Given information: Given data represents the values of the independent variable x and the dependent…
Q: If a population has a mean of 7, what is the mean of the sampling distribution of its mean?
A: We have given that Population mean=μ=7
Q: QUESTION 27 What happens to the width of a confidence interval as the sample size decreases? The…
A: Givensample size of the confidence interval decreases
Q: In a small town, there are 3,000 registered voters. An editor of a local newspaper would like to…
A:
Q: Students checked several pairs of jeans to see if the size on the label matched the actual size of…
A:
Q: 4. Suppose that Z~n(0,1) and that Y is an independent x²-distributed random variable with v df. Then…
A: Note: According to Bartleby. expert solve only one question and rest can be reposted
Q: What is a scatter diagram, and for what kind of data is it a useful descriptive device?
A: It is needed to explain about the scatter diagram.
Q: A public opinion organization wants to know if opinions on gun control laws have changed over time.…
A: Given that, a poll conducted in 2006 found that 55% of people favored stricter gun laws.
Q: Calculate Cohen's d using the following information, � =70, M = 61 and S2=36.
A: Given that, The population mean μ=70 The sample mean M=61 The sample variance S2=36 The formula for…
Q: If a population has a mean of 3.5, what is the mean of the sampling distribution if the sample size…
A: Given,sample size(n)=4population mean(μ)=3.5
Q: b) Run an ANOVA test using the statistical software package of your choice to compare solvability of…
A: Let us assume alpha=0.05 that is level of significance is 0.05 Here I have used R code to run the…
Q: Find the range and standard deviation. The table below gives the number of hours spent watching TV…
A: The question is about measures Given : To find : 1 ) Range 2 ) Sample std. deviation
Q: Problem 2. Consider the linear regression set-up Y = XB+ e where €~ Nn (0,02 In); the design matrix…
A: ANSWER: (i) LS estimates Bo and B1 are chosen to minimize the sum of squared residuals e = Y -…
Q: I need to run in SPSS to perform a stepwise linear regression? The question is Do one's smoking…
A: To perform a stepwise linear regression in SPSS, the user needs to run the following tests:…
Q: The temperature on randomly selected days throughout the year were measured. Is this an…
A: Given: The temperature on randomly selected days throughout the year were measure
Q: you start a backward elimination process with the most complex model possible Denoted by C ∗ S ∗ W,…
A: *Answer:
Q: PTC is a substance that has a strong bitter taste for some people and is tasteless for others. The…
A: It is given that margin of error (E) is 0.04 and the confidence level is 0.90.
Q: a) Calculate the sample mean and sample standard deviation for both the "Unemployment Rate" and…
A: Hi! Thank you for the question. As per the honor code, we are allowed to answer 1 question at a…
Q: if a customer buys 3 or more items they will receive a discount on shipping costs. what is the…
A: Let X be the random variable for the no. of items purchased per visit. The prob. dist. of X is, x…
Q: (Depreciation). Table 2 gives the market value of a luxury sedan (in dollars) x years after its…
A:
Q: Suppose ₁ and ₂ are true mean stopping distances at 50 mph for cars of a certain type equipped with…
A: Given that Sample size n1=9 , n2=9
Q: The manufacturer of a new eye cream claims that the cream reduces the appearance of fine lines and…
A: Given data: Considering each individual subject was measured for the no. of fine lines and wrinkles…
Q: Question 5 State the conditions under which the following models can be applied in time series data…
A: Vector Error Correction Model (VECM) can be applied when the time series data exhibits…
Q: Suppose a college admissions test is normally distributed with a mean of 500 and a standard…
A:
Q: A population of values has a normal distribution with μ = 106.4 and σ : 25.5. You intend to draw a…
A: given data, normal distributionμ=106.4σ=25.5n=85we have to find out the given probabilties.
Q: Using a sample of 1801 black individuals, the following earnings equation has been estimated: 7.059…
A: Given: Regression equation based on 1801 individuals is as follows: In(earning^) = 7.059 +…
Q: Let X be a joint Gaussian random vector X X 2 with mean and covariance tiven by: E[X] = [8] Ex = [1…
A: Let X be a joint Gaussian random vector, X=X1X2 The mean vector, EX=00 The covariance matrix,…
Q: MEAN NUMBER OF FISH IN TREATMENT COMPARTMENTS/DAY 30 25 20 15 10 (HF) FOOD NO PREDATOR (HF-P) FOOD…
A: Given the graph with error bars(standard deviation) as shown below
Need typed solution plz.

Step by step
Solved in 2 steps

- Repeat Example 5 when microphone A receives the sound 4 seconds before microphone B.2) The time between successive customers coming to the market is assumed to have Exponential distribution with parameter l. a) If X1, X2, . . . , Xn are the times, in minutes, between successive customers selected randomly, estimate the parameter of the distribution. b) b) The randomly selected 12 times between successive customers are found as 1.8, 1.2, 0.8, 1.4, 1.2, 0.9, 0.6, 1.2, 1.2, 0.8, 1.5, and 0.6 mins. Estimate the mean time between successive customers, and write down the distribution function. c) In order to estimate the distribution parameter with 0.3 error and 4% risk, find the minimum sample size.Let U1, . . . , Un be a random sample from the Unif(0,1) distribution. (a) Find the distribution of Y1 = −2 log U1 .(b) Show that the distribution Y = −2 ∑ni=1 log Ui is χv2 for some value of ν. (c) What is the value of ν in part (b)?
- X is an exponential random variable with λ =1 and Y is a uniform random variable defined on (0, 2). If X and Y are independent, find the PDF of Z = X-Y2A simple random sample X1, …, Xn is drawn from a population, and the quantities ln X1, …, ln Xn are plotted on a normal probability plot. The points approximately follow a straight line. True or false: a) X1, …, Xn come from a population that is approximately lognormal. b) X1, …, Xn come from a population that is approximately normal. c) ln X1, …, ln Xn come from a population that is approximately lognormal. d) ln X1, …, ln Xn come from a population that is approximately normal.If the random variable T is the time to failure of a commercial product and the values of its probability den-sity and distribution function at time t are f(t) and F(t), then its failure rate at time t is given by f(t)1 − F(t). Thus, thefailure rate at time t is the probability density of failure attime t given that failure does not occur prior to time t.(a) Show that if T has an exponential distribution, thefailure rate is constant. (b) Show that if T has a Weibull distribution (see Exer-cise 23), the failure rate is given by αβt β−1.
- Let X1, .... Xn be a random sample from a population with location pdf f(x-Q). Show that the order statistics, T(X1, ...., Xn) = (X(1), ... X(n)) are a sufficient statistics for Q and no further reduction is possible?As soon as one components fails, the entire system will fail. Suppose each component has a lifetime that is exponentially distributed with ? = 0.01 and that components fail independently of one another. Define events Ai = {ith component lasts at least t hours}, i = 1, . . . , 5, so that the Ais are independent events. Let X = the time at which the system fails—that is, the shortest (minimum) lifetime among the five components. P(X ≥ t)? F(t) = P(X ≤ t)? the pdf of X?a) You throw two fair dice labeled 1, . . . , 6 independently of each other and let X be the minimum of the two results. Calculate E[X2]. (b) Suppose that X has pdf given by f(x) = 3x^(−4) if x > 1 and by f(x) = 0 if x <= 1. Calculate the median of X.
- Suppose that n observations are chosen at random from a continuous pdf fY(y). What is the probability that the last observation recorded will be the smallest number in the sample? I asked this question earlier today, but didn't quite understand all of the response. P(y1<=yn)p(y2<=yn) and so on was used, but shouldn't the yn be listed first in the inequality since we want to know if yn is the smallest?LetX1,X2,...,Xn be a sequence of independent and identically distributed random variables having the Exponential(λ) distribution,λ >0, fXi(x) ={λe−λx, x >0 0, otherwise Define the random variable Y=X1+X2+···+Xn. Find E(Y),Var(Y)and the moment generating function ofY.Suppose that X is a continuous unknown all of whose values are between -5 and 5 and whose PDF, denoted f, is given by f ( x ) = c ( 25 − x^2 ) , − 5 ≤ x ≤ 5 , and where c is a positive normalizing constant. What is the expected value of X^2?

