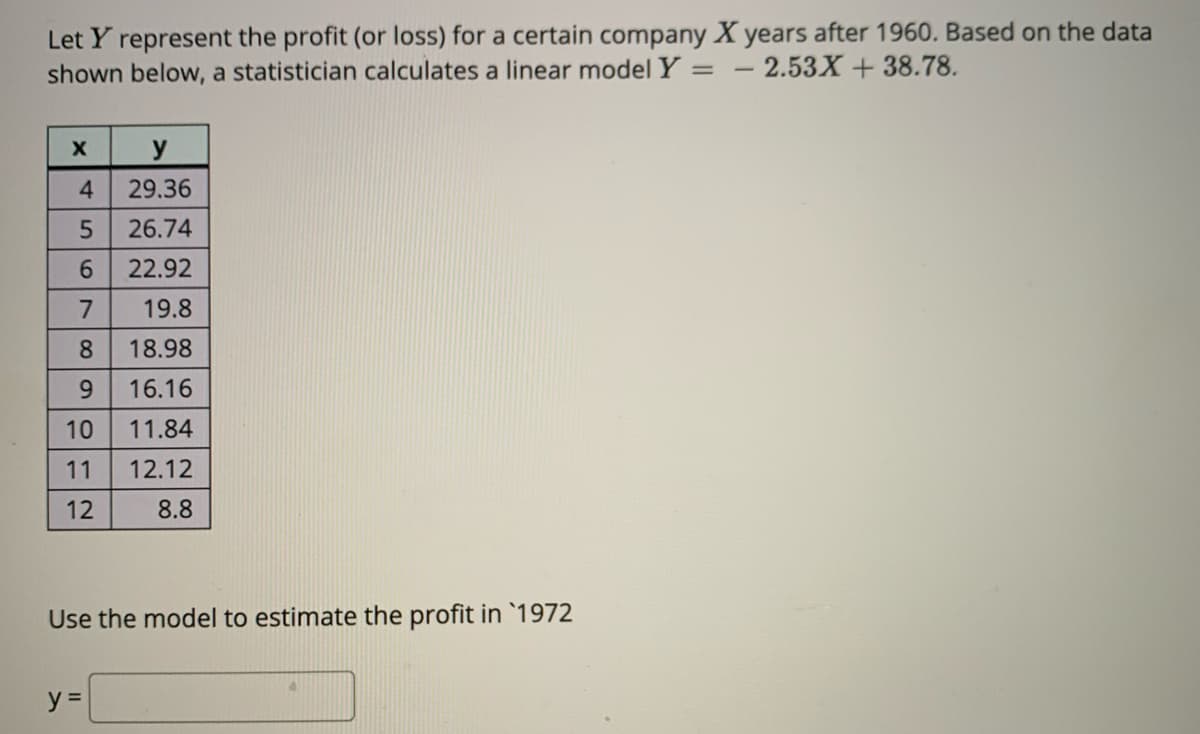
Let Y represent the profit (or loss) for a certain company X years after 1960. Based on the data shown below, a statistician calculates a linear model Y = - 2.53X+38.78. y 4 29.36 26.74 6. 22.92 7 19.8 8 18.98 9. 16.16 10 11.84 11 12.12 12 8.8 Use the model to estimate the profit in `1972 y =


Q: 9) Consider the hours of preparation, mid-term examination and final examination performance of 12…
A: a) Tabulate the given information as shown below, Hours of Preparation (x) 12 08 15 14 22 17 10…
Q: 44. A regression analysis yields the line ŷ = 32 + 0.4x. One of the subjects, Racheal, has x = 60…
A: Note: According to Bartleby expert guidelines, we can answer only first question with their three…
Q: he least-squares regression equation is y = 660.8x + 15,627 where y is the median income and x is…
A: b) The regression equation is ŷ = 660.8x + 15627, where x is the percentage of adults and older have…
Q: Bo + B1x + u, suppose that E(u) # 0. Letting a, = E(u), In the simple linear regression model y =…
A: Given that In the simple linear regression model y=, suppose that E (u) 0. Letting a = E (u),…
Q: The least-squares regression equation is y = 758.4x + 12.9 12,935 where y is the median income and…
A: We have to predict value
Q: (b) A man is selected at random from the practice. His potassium intake is 5500 mg/day, which means…
A: Answer: (a) One of the men is at the 25 percentile of potassium intake and 75 percentile of blood…
Q: The following data show the daily closing prices (in dollars per share) for a stock. Define the…
A:
Q: A. A processing line can combine unites of inputs(X) to produce units of output(Y) such that there •…
A:
Q: The table shows the marks (out of 20) in English language and chemistry obtained by different…
A: The regression equation is used to predict the value of response variable using the explanatory…
Q: Use the regression identity for multiple linear regression to show that R2 =1- SSE/SST. a. Explain…
A: a)Coefficient of multiple determination:
Q: A football coach is looking for a way to identify players that are "under weight". The coach decides…
A: Given : y=-51+3.2x The lowest weight possible for a 72 inch player to not be considered under…
Q: The least-squares regression equation is y=761.7x+13,208 where y is the median income and x is the…
A: Given: x = 26.5% y^=761.7x+13208
Q: x y 1 767 2 821 3 779 4 792 5 807 6 829 Use linear regression to find the equation for the linear…
A: Solution: The given data is
Q: x y 1 709 2 740 3 711 4 756 5 826 6 810 Use linear regression to find the equation for the linear…
A: Given data: x y 1 709 2 740 3 711 4 756 5 826 6 810
Q: The least-squares regression equation is y =712.6x+ 15,525 where y is the median income and x is the…
A: a) In this case, the least-square regression equation is ŷ = 712.6x + 15,525, where the independent…
Q: A company sets different prices for a particular stereo system in eight different regions of the…
A: Introduction: Consider that x is the independent variable and y is the dependent variable. The size…
Q: Consider the regression function C, = B, • 1, + U,, where C;indicates the household's consumption…
A:
Q: 10 - In a study, the simple linear regression equation was found as y = - 2.65 + 3.23 * x.…
A: Given simple linear regression equation: Y = - 2.65 + 3.23 * x
Q: Let y = sales at a fast-food outlet (1000s of $), x, = number of competing outlets within a 1-mile…
A: a) The multiple regression equation is Y = 12.00 – 1.1x1 + 6.8x2 + 15.3x3 + ε, where y denotes the…
Q: Let Y represent the profit (or loss) for a certain company X years after 1970. Based on the data…
A: The regression equation is Y=-2.26X+18.00.
Q: The least-squares regression equation is y=728.0x+14,705 where y is the median income and x is the…
A: From the given information, the regression equation is y=728.0x+14,705.Here, y represents the median…
Q: In order to study the relation between the number of hours which ten persons studied for a French…
A:
Q: Annual high temperatures in a certain location have been tracked for several years. Let XX represent…
A: From given data, X Y X*Y X*X 4 36.88 147.52 16 5 35.75 178.75 25 6 38.62 231.72 36 7…
Q: The least-squares regression equation is y=647.8x+17,858 where y is the median income and x is the…
A: The regression equation is given, y= 647.8 x+17,858 y=median income x=the percentage of 25 years…
Q: We have data on Lung Capacity of persons and we wish to build a multiple linear regression model…
A: Given Information: Consider the partial result from STATISTICA.
Q: Consider the regression function C, = B, • I, + U,, where C;indicates the household's consumption…
A: Given: Consider the regression function Ci = β1 * Ii + Ui, where Ci indicates the household's…
Q: The following table shows the median age of automobiles and trucks on the road for a certain country…
A: From given data, X Y X*Y X*X 1980 4.1 8118 3920400 1985 5.5 10917.5 3940225 1990 6.2 12338…
Q: Suppose that an estimated regression model is given byy^ = 0.3x + 5. Which statement is FALSE? O The…
A: We have given that Estimated regression model Y^ = 0.3X + 5
Q: 44. A regression analysis yields the line ý = 32 + 0.4x. One of the subjects, Racheal, has x = 60…
A: ŷ=32+0.4x x=60, y=52
Q: table gives the actual or Tor selected years iro to 2050. Use linear regression to find the linear…
A: Correct answer is y=0.050x+1.257
Q: Suppose data is found showing the demand for a product and its price (in dollars) in different…
A:
Q: You conducted a regression analysis between the number of absences and number of tasks missed by…
A: Given: Regression equation is y=0.65x+1.18
Q: (A) A population comprises of 9 people. Their IQ scores were recorded as 95, 135, 70,85,90,100,100,…
A: Hey there! Thank you for posting the question. Since there are multiple questions posted, we will…
Q: The age in years and hourly pay of 8 consultants are given below. Fit a linear regression model and…
A: Given : Age (Years) Hourly pay 26 400 40 550 30 450 36 500 42 570 25 350 51 700…
Q: 5. The expected sales (in RM) of a produet are assumed to be influenced by the amount of money (in…
A: Given: Sample size n=18 Significance level α=0.05 Regression model: y^=β0+β1x Where,…
Q: F69) x y 23 ; 100 76 ; 305 27 ; 105 64 ; 240 12 ; 50 51 ; 205 33 ; 120 50 ; 104 When…
A: Excel Procedure: Enter X and Y in Excel>Data>Data Analysis> ‘Regression’>Select Y under…
Q: The least-squares regression equation is y= 833.6x + 11,122 where y is the median income and x is…
A: The regression equation, Y^=833.6x+11,122where Y^, i.e the median income dependent on x. We can…
Q: Assume that we have two variables A and B and n pair of values for each of them. According to the…
A: Given data
Q: The following table shows the number of fiber optic cable connections to homes in a country from…
A: Linear regression models provide a simple approach towards supervised learning. Linear implies :…
Q: The regression linear model between two variables X and Y, in pairs, defined as X=[4,2,3,5,2,4] and…
A: The least square regression equation is given by : y=a+bxa=intercept(value of y when x=0)b=slope…
Q: The annual energy consumption in billions of Btu for both natural gas and coal is shown for a random…
A: Given that Using Excel regression
Q: Determine the regression equation 10 15 22,5 33,7 50,65 75,9 y 0,3 0,675 1,519 3,417 7,689 17,3
A: In the given question, it is required to obtain the regression equation. Regression equation: It is…
Q: The following table compares the length of a rhinoceros horn (in inc Use linear regression to find…
A:
Q: equation of the line of least squares is given as ^y= -9.12+4.38x. How many bushels of wheat peen…
A: In the area of Russia records were kept on the relationship between the rain fall in inches and the…
Q: Determine the simple linear regression model for the rental and interpret the fitted model. Provide…
A: Regression analysis
Q: The least-squares regression equation is y=784.6x+12,431 where y is the median income and x is the…
A: x=26.5% y^=784.6x+12,431
Q: Graph the population regression line by first finding the point on the line corresponding to x =…
A: Here Let x be the size of a house (in square feet) and y be the amount of natural gas used (therms)…
Q: A researcher found a linear correlation between course grades and the average number of hours spent…
A: Solution: The line of best fit is y^=3.7-0.786×x Where y = Course grades and x = average number of…
Q: A researcher collects data between the age in years, (x), of a movie theater's popcorn popper and…
A: Step: 1 Enter the data into the excel spreadsheet. Step: 2 Select the data and click on the Insert…
Q: In a simple linear regression model, y=β0+β1x+ϵ the parameter β1 represents the Select one: a.…
A:


Trending now
This is a popular solution!

Step by step
Solved in 2 steps

- The least-squares regression equation is y=728.0x+14,705 where y is the median income and x is the percentage of 25 years and older with at least a bachelor's degree in the region. The scatter diagram indicates a linear relation between the two variables with a correlation coefficient of 0.8165. For every dollar increase in median income, the percent of adults having at least a bachelor's degree is ___%, on average. For a median income of $0, the percent of adults with a bachelor's degree is ____%.Use the general equation for the least square regression line to show that this line always passes through the point (x,y) * bars above the x and y.That is, set x=x(with a bar above the x) and show that the line predicts that y=y (with a bar above the y).Calculate the simple linear regression to determine if the amount of sleep (y) can be predicted by time spent on homework (x). Graph the relationship and determine, numerically, if there are any outliers. Interpret all results in a paragraph citing the appropriate statistics. Sleep in minutes (Y): 360,400,420,440,540,480,320,440,360,420,420,390,360,480,360,360,480,420,360,480,270,360,420,360,420 Homework in minutes (X): 30,45,60,15,75,120,80,60,100,45,60,50,60,120,60,60,60,60,90,180,165,90,60,60,90
- The least-squares regression equation is y=620.6x+16,624 where y is the median income and x is the percentage of 25 years and older with at least a bachelor's degree in the region. The scatter diagram indicates a linear relation between the two variables with a correlation coefficient of 0.7004. Predict the median income of a region in which 30% of adults 25 years and older have at least a bachelor's degree.On the second sheet is data which shows the rate of growth of a particular patch of bamboo vs daily high temperature.(a) Construct a scatterplot, including the equation of the line of best fit and value of R2.(b) What would the predicted growth rate be for a day with a temperature of 84◦?(c) Is there evidence, at α = 0.01, to support a claim that there is a linear relationship between temperature and growth rate? Please state clearly the null hypothesis, the alternative hypothesis, and what decision you make.The table below shows the amounts of crude oil (in thousands of barrels per day) produced by a country and the amounts of crude oil (in thousands of barrels per day) imported by a country, for the last seven years. Construct and interpret a 95% prediction interval for the amount of crude oil imported by the this country when the amount of crude oil produced by the country is 5,509 thousand barrels per day. The equation of the regression line is ModifyingAbove .y=−1.137x+15,912.199. Oil produced, x 5,830 5,704 5,645 5,405 5,159 5,053 5,028 Oil imported, y 9,300 9,117 9,628 10,062 10,119 10,159 10,013 Construct and interpret a 95% prediction interval for the amount of crude oil imported when the amount of crude oil produced by the country is 5,509 thousand barrels per day. Select the correct choice below and fill in the answer boxes to complete your choice. (Round to the nearest cent as needed.) A. We can be 95% confident…
- The least-squares regression equation is y=647.8x+17,858 where y is the median income and x is the percentage of 25 years and older with at least a bachelor's degree in the region. The scatter diagram indicates a linear relation between the two variables with a correlation coefficient of 0.7507. predict the median income of a region in which 20% of adults 25 years and older have at least a bachelor's degree. Round to the nearest dollar as needed.Let x be the size of a house (in square feet) and y be the amount of natural gas used (therms) during a specified period. Suppose that for a particular community, x and y are related according to the simple linear regression model with the following values. ? = slope of population regression line = 0.016 ? = y intercept of population regression line = −7 Question: Graph the population regression line by first finding the point on the line corresponding to x = 1,000 and then the point corresponding to x = 2,000, and drawing a line through these points.he following estimated regression model was developed relating yearly income (y in $1000s) of 30 individuals with their age (x1) and their gender (x2) (0 if male and 1 if female).ŷ = 30 + 0.7x1 + 3x2Also provided are SST = 1200 and SSE = 384. The yearly income of a 24-year-old female individual is
- The annual energy consumption in billions of Btu for both natural gas and coal is shown for a random selection of states. Gas 223 474 377 289 747 146 Coal 478 631 413 356 736 474 If 500 billion Btu of natural gas is used then what is the projected amount of coal that is usedThe projected amount of coal that is used is billion Btu. (Use your regression equation with the rounded values for m and b to find your answer to this question. Round your answer to THREE decimal places, add extra zeros at the end, if needed) (Round answer to 3 decimal places, for example, XXX.XXX)The least-squares regression equation is y=784.6x+12,431 where y is the median income and x is the percentage of 25 years and older with at least a bachelor's degree in the region. The scatter diagram indicates a linear relation between the two variables with a correlation coefficient of 0.7962. Interpret the slope.The least-squares regression equation is y = 758.4x + 12.9 12,935 where y is the median income and is the percentage of 25 years and older with at least a bachelor's degree in the region. The scatter diagram indicates a linear relation between the two variables with a correlation coefficient of 0.7500. (a) Predict the median income of a region in which 30% of adults 25 years and older have at least a bachelor's degree.