A. A processing line can combine unites of inputs(X) to produce units of output(Y) such that there • is a linear relationship between X and Y. Given the values of X and Y as follow: 7 5 2 Y 8 14 12 (1) Formulate a simple linear regression equation. (Hi) Determine the value of the correlation coefficient and interpret your result. (ii) Find the value of the coefficient of determination and interpret your results. (iv) What will be the output level if the input is 20? (v) What proportion of the variation in output is not due to X? (vi) Using a = 0.01 test whether the correlation between X and Y are positively linearly correlated. 6.
A. A processing line can combine unites of inputs(X) to produce units of output(Y) such that there • is a linear relationship between X and Y. Given the values of X and Y as follow: 7 5 2 Y 8 14 12 (1) Formulate a simple linear regression equation. (Hi) Determine the value of the correlation coefficient and interpret your result. (ii) Find the value of the coefficient of determination and interpret your results. (iv) What will be the output level if the input is 20? (v) What proportion of the variation in output is not due to X? (vi) Using a = 0.01 test whether the correlation between X and Y are positively linearly correlated. 6.

College Algebra
7th Edition
ISBN:9781305115545
Author:James Stewart, Lothar Redlin, Saleem Watson
Publisher:James Stewart, Lothar Redlin, Saleem Watson
Chapter1: Equations And Graphs
Section: Chapter Questions
Problem 10T: Olympic Pole Vault The graph in Figure 7 indicates that in recent years the winning Olympic men’s...

Related questions

Concept explainers
Equations and Inequations
Equations and inequalities describe the relationship between two mathematical expressions.
Linear Functions
A linear function can just be a constant, or it can be the constant multiplied with the variable like x or y. If the variables are of the form, x2, x1/2 or y2 it is not linear. The exponent over the variables should always be 1.
Question
Please solve iv,v and vi only thanks
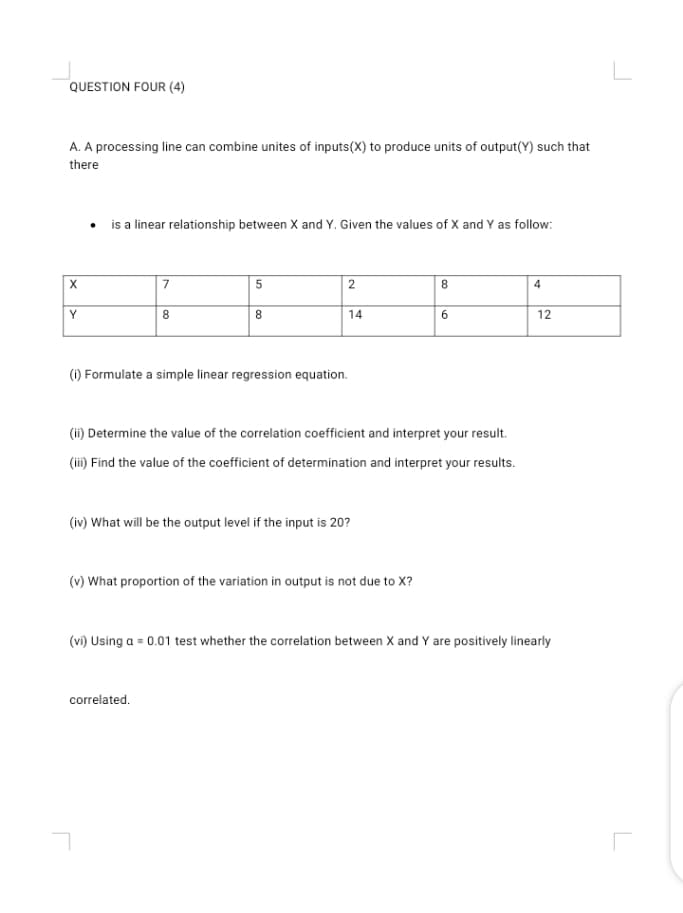
Transcribed Image Text:A. A processing line can combine unites of inputs(X) to produce units of output(Y) such that
there
• is a linear relationship between X and Y. Given the values of X and Y as follow:
7
5
2
Y
8
14
12
(1) Formulate a simple linear regression equation.
(Hi) Determine the value of the correlation coefficient and interpret your result.
(ii) Find the value of the coefficient of determination and interpret your results.
(iv) What will be the output level if the input is 20?
(v) What proportion of the variation in output is not due to X?
(vi) Using a = 0.01 test whether the correlation between X and Y are positively linearly
correlated.
6.
Expert Solution

Step by step
Solved in 9 steps with 4 images

Knowledge Booster


Learn more about
Need a deep-dive on the concept behind this application? Look no further. Learn more about this topic, statistics and related others by exploring similar questions and additional content below.Recommended textbooks for you
College Algebra
Algebra
ISBN:
9781305115545
Author:
James Stewart, Lothar Redlin, Saleem Watson
Publisher:
Cengage Learning

Elementary Linear Algebra (MindTap Course List)
Algebra
ISBN:
9781305658004
Author:
Ron Larson
Publisher:
Cengage Learning

Functions and Change: A Modeling Approach to Coll…
Algebra
ISBN:
9781337111348
Author:
Bruce Crauder, Benny Evans, Alan Noell
Publisher:
Cengage Learning
College Algebra
Algebra
ISBN:
9781305115545
Author:
James Stewart, Lothar Redlin, Saleem Watson
Publisher:
Cengage Learning
Elementary Linear Algebra (MindTap Course List)
Algebra
ISBN:
9781305658004
Author:
Ron Larson
Publisher:
Cengage Learning
Functions and Change: A Modeling Approach to Coll…
Algebra
ISBN:
9781337111348
Author:
Bruce Crauder, Benny Evans, Alan Noell
Publisher:
Cengage Learning