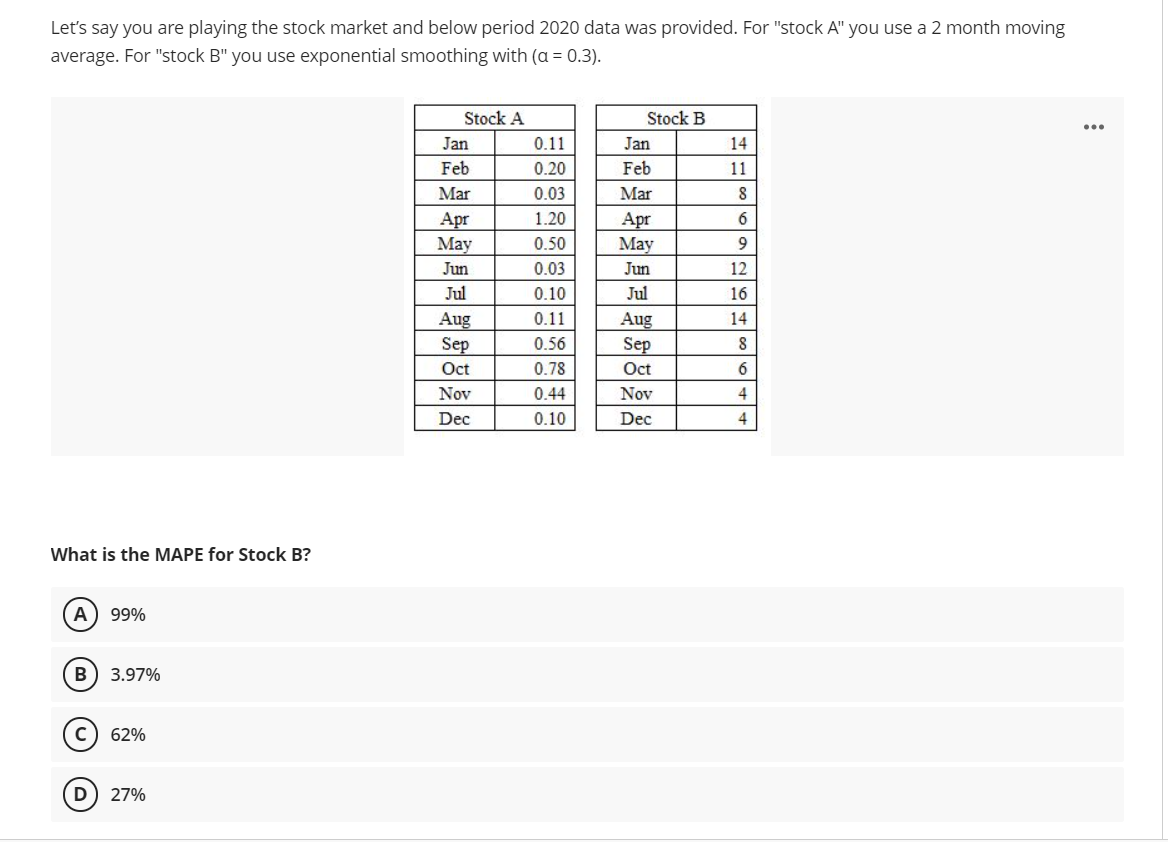
Let's say you are playing the stock market and below period 2020 data was provided. For "stock A" you use a 2 month moving average. For "stock B" you use exponential smoothing with (a = 0.3). Stock A Stock B Jan 0.11 Jan 14 Feb 0.20 Feb 11 Mar 0.03 Mar Apr May 1.20 Apr 6 0.50 May 9. Jun 0.03 Jun 12 Jul 0.10 Jul 16 Aug Sep 0.11 Aug 14 0.56 Sep Oct 0.78 Oct Nov 0.44 Nov 4 Dec 0.10 Dec 4 What is the MAPE for Stock B? А 99% в) 3.97% 62% 27%
Q: The program manager wants to forecast conference attendees. Based on the following historical data,…
A: The following information has been given: Year Total Enrollment 1 2950 2 2200 3 2000 4…
Q: Q 5: Al Matra LLC has recently hired Mr. Musab, a professional market researcher. Mr. Musab is…
A:
Q: Consider the following data: Monthly Profit of a Gym: Month & Profit: Jan-12: 5800 Feb-12: 5553…
A: Given the data on the monthly profit of a Gym. The table below shows the required calculation-
Q: A pharmacist has been monitoring sales of a certain over-the-counter pain reliever. Daily sales…
A:
Q: Consider the following data. Period Rate of Return (%) 1 - 6.0 2 - 8.2 3 - 4.2 4 2.2 5 5.6 What is…
A: Given Period Rate of return 1 -6.0 2.…
Q: Consider the following data: Monthly Profit of a Gym: Month & Profit: Jan-12: 5700 Feb-12: 5453…
A: The Monthly Profit of the Gym is given as : Month Profit Jan-12 5700 Feb-12 5453…
Q: Using excel. For the Hawkins Company, the monthly percentages of all shipments received on time over…
A: a) The given information is that the monthly percentages of company Hawkin’s entire shipments of…
Q: Aiman recently graduated from engineering school and has taken a position as assistant manager at a…
A: forecasting methods
Q: Amex PLC has gathered following information on the sales of face mask from April 2020 to September…
A: Given, information gathered by PLC on the sales of face mask from April 2020 to September 2020. a)…
Q: A convenience store recently started to carry a new brand of soft drink. Management is interested in…
A: Given data: .
Q: Suppose you think that there are diminishing returns to studying. Test this hypothesis by opening up…
A: GPA and. study hourcorrelation test
Q: Consider the following data. Period Rate of Return (%) 1 - 5.8 2 - 8.0 - 3.8 4 2.0 5 5.2 What is the…
A:
Q: (1) Four-month moving average; (2) Weighted three-month moving average using .50 for June, .30 for…
A: Time series is a stream of historical data. It is of 2 types- Stationary and Non-stationary. The…
Q: Q Monthly sales for a six month period are as follows: Month Sales Jan 18,000 Feb 22,000 16,000 Mar…
A: Given Information: Month Sales January 18000 February 22000 March 16000 April 18000 May…
Q: Compute the one-step-ahead 3-month and 6-month moving-average forecasts for July through December.…
A: Given information: The data presents the sample for the months January through December.
Q: Using excel. For the Hawkins Company, the monthly percentages of all shipments received on time over…
A: Given: For the Hawkins Company, the monthly percentages of all shipments received on time over the…
Q: consider the following data. Period Rate of Return (%) - 5.8 2 - 7.8 3 -4.0 4 2.0 5.4 What is the…
A: E[x] =∑xp(x)
Q: A pharmacist has been monitoring sales of a certain over-the-counter pain reliever. Daily sales dur-…
A:
Q: A convenience store recently started to carry a new brand of soft drink. Management is interested in…
A: Given data: Week(x) Actual(Y) 1 617 2 617 3 648 4 739 5 659 6 623 7 742 8 704…
Q: months are displayed. Data downloaded on 2/19/2020 from https://data.world/cityofaustin/cfer-vyii.…
A:
Q: Q3. Consider the following data. Period…
A: For the given data What is the mean growth rate over these five periods?
Q: 5 Calanute Beach Resort, a fictional seaside luxury hotel | in Goa, India, had the following…
A:
Q: Aiman recently graduated from engineering school and has taken a position as assistant manager at a…
A: Forecasting error analysis
Q: Annual profit of a company (in million taka) are given below. Year 2010 2011 2012 2013 2014 2015…
A: Exponential smoothing forecast method is used to forecast the immediate future values. Exponential…
Q: A convenience store recently started to carry a new brand of soft drink. Management is interested in…
A: ii) Given information: Period Sales 1 572 2 618 3 658 4 747 5 643 6 614 7 748 8…
Q: i asked this question previously and got the wrong answers. Everything after the 2008 row was wrong.…
A:
Q: Which one of the following statements about forecasting is FALSE? A. You should use the simple…
A:
Q: Pink Table, a snack shop has recorded sales for its best-selling cold drink, shown as follows: Day…
A: The following information has been given: Day jasmine slush 1 125 2 136 3 127 4 123 5…
Q: A police station had to deploy police officers for emergencies multiple times the lastfour evenings.…
A: The given data is suitable for exponential smoothing technique.
Q: The forecaster in augments her AR(4) model for IP growth to include four lagged values of ΔRt, where…
A: (a) One useful application of the F-statistic in time series forecasting is to test whether the lags…
Q: 9- Following table presents the quarterly market share of Tasty Food Company; uarter Firm's Actual…
A: Formula Ft+1 =wAt + (1-w)Ft __________________________ RMSE = ∑Error2N
Q: Make forecasts using the following fitted trend models for years 2017-2019. (Round your answers to…
A: The year 2007 can be labeled as 1, the year 2008 can be labelled as 2, and so on. The data inserted…
Q: 7. The following table represents the new members that have been acquired by a fitness center. New…
A: Given, α = 0.3 and β = 0.4. The initial forecast is equal to 40. The trend adjusted exponential…
Q: A convenience store recently started to carry a new brand of soft drink. Management is interested in…
A: Since you have asked multiple questions, we will solve the first question for you. If you want any…
Q: This is a subjective question, hence you have to write your answer in the Text-Field given below.…
A: Given Data : Month Cases October 26 November 20 December 11 January 9 February 14…
Q: A certain company produces and sells frozen pizzas to public schools throughout the eastern United…
A: a) Excel Procedure: Enter year and Revenue in Excel sheet>Select year and revenue>Insert…
Q: Let's say you are playing the stock market and below period 2020 data was provided. For "stock A"…
A:
Q: The number of heart surgeries performed at Heartville General Hospital has increased steadily over…
A: Disclaimer, Since you have asked multiple question, we will solve the first question for you. If you…
Q: The Bayside Fountain Hotel is adjacent to County Coliseum, a 24,000-seat arena that is home tothe…
A:
Q: onsider the following data. Period…
A: Given: Periods Rate of return (%) 1 -6 2 -8 3 -4 4 2 5 5.4
Q: U.S. Civilian Labor Force (thousands) Year Labor Force Year Labor Force 2007 153,918 2012…
A: Hi! Thank you for posting the question. Since you have posted multiple questions, we are answering…
Q: Let's say you are playing the stock market and below period 2020 data was provided. For "stock A"…
A: Given data is :
Q: Let's say you are playing the stock market and below period 2020 data was provided. For "stock A"…
A: Given :For stock B we can use exponential smoothing α=0.3
Q: Here's a table with average monthly price of a stock from Jan 2021-July 2021. Month Price Jan 29000…
A:
Q: Question: MegaPizza is a successful startup that sees its demand for pizza increase quickly. For the…
A: Given data: 342, 411, 501, 619, 702 and 777 Smoothing parameter=0.3
Q: Below is a table containing data on product demand for the most recent five months along with the…
A: Given Information Month Demand Forecast 1 308 349.2 2 388 340.9 3 344 350.3 4 400 349.1…
q48
Step by step
Solved in 2 steps with 2 images
- A pizza chain has had sales for take-out food over the last four evenings—Monday, Tuesday, Wednesday, and Thursday—of 29, 25, 35, and 30 pizzas, respectively.What would be their forecast for Friday using an exponential smoothing forecastingapproach? Use α = 0.2 and a forecast for Monday of 28.The manager of a popular tourist resort wants to use the manual trend projection forecasting technique and exponential smoothing without trend to forecast room occupancy at the resort for the next 4 years. Using numerical example, demonstrate how these techniques can be used to do the forecast.Why is it that the exponential smoothing method offers a better forecast accuracy?
- The R-squared of a regression of an asset’s excess returns against a multi-factor asset pricing model indicates the proportion of the asset’s total volatility that is non-systematic. True FalseSuppose that the Perpetual Help College of Rizal had the following record of its growth of enrollment from 2011 -2020. Year Enrolment Year Enrolment 2011 5,200 2016 7,000 2012 5,500 2017 8,800 2013 6,000 2018 9,400 2014 6,500 2019 9,600 2015 6,800 2020 10,500 c) Using exponential smoothing and smoothing constant of .30 and 2011 previous forecast of 5200, develop a forecast of enrolment from 2012 to 2021. d) Forecast enrollment using Trend line Projection from 2011 to 2021. e) Evaluate forecast accuracy of each forecast model using MSE .…For the Hawkins Company, the monthly percentages of all shipments received on time over the past 12 months are 80, 82, 84, 83, 83, 84, 85, 84, 82, 83, 84, and 83. Compare a three-month moving average forecast with an exponential smoothing forecast for α = 0.2. Which provides the better forecasts using MSE as the measure of model accuracy? Do not round your interim computations and round your final answers to three decimal places. Movingaverage Exponentialsmoothing MSE What is the forecast for next month? If required, round your answer to two decimal places.
- The Bayside Fountain Hotel is adjacent to County Coliseum, a 24,000-seat arena that is home tothe city’s professional basketball and ice hockey teams and that hosts a variety of concerts, tradeshows, and conventions throughout the year. The hotel has experienced the following occupancyrates for the past 9 years, since the coliseum opened:Year Occupancy Rate (%)1 832 783 754 815 866 857 898 909 86 Compute an exponential smoothing forecast with a = .20, an adjusted exponential smoothingforecast with a = .20 and B=30 and a linear trend line forecast. Compare the three forecasts,using MAD and average error ( ), and indicate which seems to be most accurate.Ten years ago, the town of Easton decided to increase its annual spending on education so that its high school graduates would be able to earn higher wages. Now Easton has asked you to evaluate the effectiveness of the spending increase. Their data show that before the spending increase, the average annual salary of recent high school graduates was $25,000 and that now that average salary has risen to $28,500. Fortunately for your analysis, a neighboring community (Allentown) did not change its annual spending on education. Ten years ago, recent Allentown high school graduates earned an average of $22,500, and now that average is $23,750. (b) What underlying assumption do you have to make in order for your estimate to be valid? What might cause your underlying assumption to be invalid?Ten years ago, the town of Easton decided to increase its annual spending on education so that its high school graduates would be able to earn higher wages. Now Easton has asked you to evaluate the effectiveness of the spending increase. Their data show that before the spending increase, the average annual salary of recent high school graduates was $25,000 and that now that average salary has risen to $28,500. Fortunately for your analysis, a neighboring community (Allentown) did not change its annual spending on education. Ten years ago, recent Allentown high school graduates earned an average of $22,500, and now that average is $23,750. (a) Use a difference-in-differences estimator to determine whether Easton’s spending increase caused the wages of their high school graduates to increase. please provide an accurate answer.
- What kind of effects are reported in the tables for Tobit (are these marginal effects or not?). Explain if marginal and if not marginal why?With the gasoline time series data from table 17.1, show the exponential smoothing forecasts using a = .1.a. applying the MSe measure of forecast accuracy, would you prefer a smoothing constant of a = .1 or a = .2 for the gasoline sales time series?b. are the results the same if you apply Mae as the measure of accuracy?c. What are the results if Mape is used?Over the past 14 months,the monthly percentages of all shipments received on time are Monthy Proportion of On Tme Shipments 72 81 78 90 83 85 90 82 89 81 85 84 78 88 What is MSE using exponential smoothing forecast for α=0.3? (keep 2 decimal points)