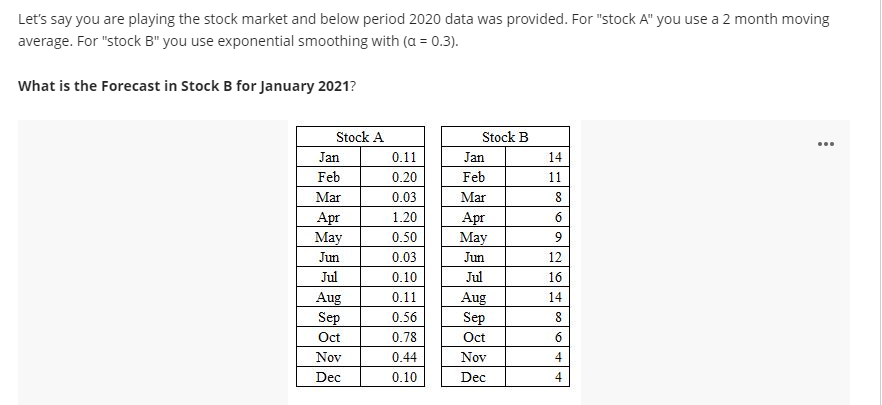
Let's say you are playing the stock market and below period 2020 data was provided. For "stock A" you use a 2 month moving average. For "stock B" you use exponential smoothing with (a = 0.3). What is the Forecast in Stock B for January 2021?


Q: If the forecasted demand for the week of August 31 is 360 and α = 0.20, using exponential…
A: Sept. 7 forecast = Aug. 31 forecast + alpha (Aug. 31 demand- Aug. 31 forecast) Sept. 7 forecast =…
Q: Choose the type of forecasting technique (survey, Delphi, averaging, seasonal, naive, trend,…
A: Delphi Technique of forecasting would be appropriate to predict the demand for vacations on the…
Q: Consider the following set of time series sales data for a growing company over the past 8 months:…
A: The time series plot shows a horizontal pattern.
Q: Explain why forecasting devices such as moving averages, weighted moving averages, and exponential…
A: The average is going The prediction is increased and n is flat, but less susceptible. It provides an…
Q: A manager of a store that sells and installs spas wants to prepare a forecast for January, February,…
A: The trend equation for monthly demand: Ft = 70 + 5t Where t = 0 in June of last year. In this…
Q: What is the forecast using exponential smoothing with alpha = .6? 2. If we decide to…
A: ANSWER IS AS FOLLOWS:
Q: Given forecast errors of 4, 8, and −3, what is the mean absolute deviation (MAD) and mean square…
A: Forecast errors = 4,8 and -3 Absolute errors = 4, 8 and 3
Q: The table below shows the demand for a particular brand of microwave oven in a department store.…
A: Given-
Q: The demand for Krispee Crunchies, a favorite breakfast cereal of people born in the 1940s, is…
A:
Q: The Grand Bakery produces 60 special sourdough rolls every day. Any rolls that are not sold each day…
A: Forecasting is the process of prediction in which sales demand is estimated using historic…
Q: Sales of Volkswagen's popular Beetle have grown steadily at auto dealerships in Nevada during the…
A:
Q: Sales of Volkswagen's popular Beetle have grown steadily at auto dealerships in Nevada during the…
A: When α=0.30 Period Sales Forecasted Sales Actual - Forecast 2005 455 415 40 2006 510 427 83…
Q: Period Actual 1 12 2 15 16 4 16 Given the information in the following table, Use exponential…
A: Note: - Since the actual data for period 5 is not given, the trend-adjusted forecast can be made by…
Q: omplete the data on the table by considering the forecasting method indicated in each column. Show…
A: Forecasting means predicting in advance what would be the estimated sales of future periods by…
Q: Lenovo uses the ZX-81 chip in some of its laptop computers. The prices for the chip during the last…
A: Find the Given details below: Given details: Month Price Per Chip ($) January 1.90 February…
Q: The following table contains the demand from the last 10 months. Calculate the single exponential…
A: The general formula of exponential smoothing: forecast = actual demand of previous period…
Q: What is the value of your forecast? PX If instead the weights were 20, 15, 15, and 10, respectively,…
A: ANSWERS ARE GIVEN BELOW:
Q: You discovered that the forecasting error falls beyond the acceptable ranges in the past three…
A: Find the given details below: Given details: Period Actual Forecast (A-F) Error (A) (F)…
Q: A manufacturer of printed circuit boards uses exponentialsmoothing with trend to forecast monthly…
A: The image given in step 2 gives a detailed solution of the question that has been asked.
Q: You work for BMW as a planner. BMW is expecting to increase its annual sales for BMW- X5 in year…
A: BMW-X5 sales are increasing by 10% every quarter looking at as per the given data. let us clarify…
Q: I'm trying to forecast how many TV's my shop will sell in 2021. I have data for the previous 4…
A: Forecasts generated applying exponential smoothing techniques are weighted averages of preceding…
Q: Discuss what are the benefits as a prediction tool over the moving average of exponential smoothing?
A: Exponential smoothing is more adaptable than sliding midpoints in that it allows for easy adjustment…
Q: A diary product manufacturing company uses simple exponential smoothing with trend to forecast…
A: Given data is Alpha = 0.15 Beta = 0.20
Q: Demand and forecast for 5 months are given below: Month Demand Forecast 1 50 46 2 52 52 3…
A: Tracking Signal is used to determine the larger deviation (in both plus and minus) of Error in…
Q: Given the actual demand for years 2013/14, calculate the total forecast for year 2015, as well as…
A: Below is the solution:-
Q: Sales of Volkswagen's popular Beetle have grown steadily at auto dealerships in Nevada during the…
A:
Q: hovo uses the ZX-81 chip in some of its laptop computers. The prices for the chip during the last 12…
A: a) b)
Q: The demand for Krispee Crunchies, a favorite breakfast cereal of people born in the 1940s, is…
A: Trend forecast is a quantitative data forecasting method where we use past data for finding out…
Q: The company's sales history (in thousands of units) is shown in the table below. Use exponential…
A: Concept and formulas used: FIT = Forcast Including Trend FIT = Ft + Tt Ft = FITt-1 + a…
Q: Below you are given the first five values of a quarterly time series of sales. Year Time Series…
A: Find the Given details below: Given details: Year Quarter Time Series Value Y1 1 1 36 2 24…
Q: Sales of Volkswagen's popular Beetle have grown steadily at auto dealerships in Nevada during the…
A: MAD(Mean Absolute Deviation) = Sum of absolute deviations/Number of periods
Q: Use simple exponential smoothing with a -0.8 to forecast electric scooter sales at Guelph- Humber…
A: Given data, MAY 42 JUNE 47 JULY 45 AUGUST 40
Q: A firm uses simple exponential smoothing with trend adjustment to forecast demand, "a = 0.6" and…
A: Given, TAF for first month TAF1 = 434 units Actual demand for first period A1= 488 units Trend T1 =…
Q: c. Using simple exponential smoothing, what would your forecast be for this month if the…
A:
Q: The manager of a travel agency has been using a seasonally adjusted forecast to predict demand for…
A: Mean absolute deviation determines the prediction's accuracy by averaging the specified inaccuracy…
Q: Considering the fact that the number of students is relatively constant throughout the academic…
A: 1. The formula for 3 month weighted moving average IS- Ft = wt-1*Dt-12Dt-2 3Dt-3 Where, Ft =…
Q: Choose the type of forecasting technique (survey, Delphi, averaging, seasonal, naive, trend,…
A: Seasonal forecast is a type where the prediction is done only in that particular season. This is…
Q: 1. What is the tracking signal for the forecast?
A: Forecasting is the process of predicting future demand according to the previous information or…
Q: My problem asks me to Forecast using a "simple 4-month moving average" but when I calcualte that, I…
A: A) Month Units Sold May 1500 June 1400 July 1800 August 1500…
Q: Forecast is calculating estimates of future cycle/s based on data of past cycles -- there is no…
A: Forecasting is a prediction method that can use historical data and current market trends and…
Q: True Beauty is a cosmetics company that uses exponentialsmoothing with trend to forecast monthly…
A: Given data In the solution, three equations will be used to develop forecasts including trends.…
Q: a) Calculate the forecasted registrations for years 2 through 12 using exponential smoothing, with a…
A: ANSWER IS AS FOLLOWS:
Q: Use the following information to compute a single exponential smoothing model forecast with a…
A: From the above information, Let, Forecast for period 1 =f1 =115 Actual value for period 1 =a1…
Q: As you can see in the following table, demand for heart transplant surgery at Washington General…
A: The concept used here is forecasting with the Exponential Smoothening method.
Q: The manager of a travel agency asked you to come up with a forecasting technique that will best fit…
A: Given - Smoothing constant (α) = 0.25 Period Demand F1 F2 1 115 - - 2 176 - - 3 97 146…
Q: Mark Gershon, owner of a musical instrument distributorship, thinks that demand for guitars may be…
A: Given information, Maroon 5 Tv 3 4 7 6 8 5 Demand for Guitars 3 6 7 5 10 7
Q: Calculate and answer parts a through d. Include all calculations and spreadsheets in your post.…
A: Formula: Answer:
Q: Sales of Volkswagen's popular Beetle have grown steadily at auto dealerships in Nevada during the…
A:
Q: It has been said that forecasting using exponential smoothing is like driving a car by looking in…
A: Exponential smoothing is a time series forecasting technique for univariate data that can be…

Step by step
Solved in 3 steps with 4 images

- The Baker Company wants to develop a budget to predict how overhead costs vary with activity levels. Management is trying to decide whether direct labor hours (DLH) or units produced is the better measure of activity for the firm. Monthly data for the preceding 24 months appear in the file P13_40.xlsx. Use regression analysis to determine which measure, DLH or Units (or both), should be used for the budget. How would the regression equation be used to obtain the budget for the firms overhead costs?The file P13_22.xlsx contains total monthly U.S. retail sales data. While holding out the final six months of observations for validation purposes, use the method of moving averages with a carefully chosen span to forecast U.S. retail sales in the next year. Comment on the performance of your model. What makes this time series more challenging to forecast?The file P13_42.xlsx contains monthly data on consumer revolving credit (in millions of dollars) through credit unions. a. Use these data to forecast consumer revolving credit through credit unions for the next 12 months. Do it in two ways. First, fit an exponential trend to the series. Second, use Holts method with optimized smoothing constants. b. Which of these two methods appears to provide the best forecasts? Answer by comparing their MAPE values.
- The file P13_02.xlsx contains five years of monthly data on sales (number of units sold) for a particular company. The company suspects that except for random noise, its sales are growing by a constant percentage each month and will continue to do so for at least the near future. a. Explain briefly whether the plot of the series visually supports the companys suspicion. b. By what percentage are sales increasing each month? c. What is the MAPE for the forecast model in part b? In words, what does it measure? Considering its magnitude, does the model seem to be doing a good job? d. In words, how does the model make forecasts for future months? Specifically, given the forecast value for the last month in the data set, what simple arithmetic could you use to obtain forecasts for the next few months?The file P13_26.xlsx contains the monthly number of airline tickets sold by the CareFree Travel Agency. a. Create a time series chart of the data. Based on what you see, which of the exponential smoothing models do you think will provide the best forecasting model? Why? b. Use simple exponential smoothing to forecast these data, using a smoothing constant of 0.1. c. Repeat part b, but search for the smoothing constant that makes RMSE as small as possible. Does it make much of an improvement over the model in part b?The file P13_28.xlsx contains monthly retail sales of U.S. liquor stores. a. Is seasonality present in these data? If so, characterize the seasonality pattern. b. Use Winters method to forecast this series with smoothing constants = = 0.1 and = 0.3. Does the forecast series seem to track the seasonal pattern well? What are your forecasts for the next 12 months?
- The file P13_29.xlsx contains monthly time series data for total U.S. retail sales of building materials (which includes retail sales of building materials, hardware and garden supply stores, and mobile home dealers). a. Is seasonality present in these data? If so, characterize the seasonality pattern. b. Use Winters method to forecast this series with smoothing constants = = 0.1 and = 0.3. Does the forecast series seem to track the seasonal pattern well? What are your forecasts for the next 12 months?Suppose that a regional express delivery service company wants to estimate the cost of shipping a package (Y) as a function of cargo type, where cargo type includes the following possibilities: fragile, semifragile, and durable. Costs for 15 randomly chosen packages of approximately the same weight and same distance shipped, but of different cargo types, are provided in the file P13_16.xlsx. a. Estimate a regression equation using the given sample data, and interpret the estimated regression coefficients. b. According to the estimated regression equation, which cargo type is the most costly to ship? Which cargo type is the least costly to ship? c. How well does the estimated equation fit the given sample data? How might the fit be improved? d. Given the estimated regression equation, predict the cost of shipping a package with semifragile cargo.The owner of a restaurant in Bloomington, Indiana, has recorded sales data for the past 19 years. He has also recorded data on potentially relevant variables. The data are listed in the file P13_17.xlsx. a. Estimate a simple regression equation involving annual sales (the dependent variable) and the size of the population residing within 10 miles of the restaurant (the explanatory variable). Interpret R-square for this regression. b. Add another explanatory variableannual advertising expendituresto the regression equation in part a. Estimate and interpret this expanded equation. How does the R-square value for this multiple regression equation compare to that of the simple regression equation estimated in part a? Explain any difference between the two R-square values. How can you use the adjusted R-squares for a comparison of the two equations? c. Add one more explanatory variable to the multiple regression equation estimated in part b. In particular, estimate and interpret the coefficients of a multiple regression equation that includes the previous years advertising expenditure. How does the inclusion of this third explanatory variable affect the R-square, compared to the corresponding values for the equation of part b? Explain any changes in this value. What does the adjusted R-square for the new equation tell you?
- A small computer chip manufacturer wants to forecast monthly ozperating costs as a function of the number of units produced during a month. The company has collected the 16 months of data in the file P13_34.xlsx. a. Determine an equation that can be used to predict monthly production costs from units produced. Are there any outliers? b. How could the regression line obtained in part a be used to determine whether the company was efficient or inefficient during any particular month?Play Things is developing a new Lady Gaga doll. The company has made the following assumptions: The doll will sell for a random number of years from 1 to 10. Each of these 10 possibilities is equally likely. At the beginning of year 1, the potential market for the doll is two million. The potential market grows by an average of 4% per year. The company is 95% sure that the growth in the potential market during any year will be between 2.5% and 5.5%. It uses a normal distribution to model this. The company believes its share of the potential market during year 1 will be at worst 30%, most likely 50%, and at best 60%. It uses a triangular distribution to model this. The variable cost of producing a doll during year 1 has a triangular distribution with parameters 15, 17, and 20. The current selling price is 45. Each year, the variable cost of producing the doll will increase by an amount that is triangularly distributed with parameters 2.5%, 3%, and 3.5%. You can assume that once this change is generated, it will be the same for each year. You can also assume that the company will change its selling price by the same percentage each year. The fixed cost of developing the doll (which is incurred right away, at time 0) has a triangular distribution with parameters 5 million, 7.5 million, and 12 million. Right now there is one competitor in the market. During each year that begins with four or fewer competitors, there is a 25% chance that a new competitor will enter the market. Year t sales (for t 1) are determined as follows. Suppose that at the end of year t 1, n competitors are present (including Play Things). Then during year t, a fraction 0.9 0.1n of the company's loyal customers (last year's purchasers) will buy a doll from Play Things this year, and a fraction 0.2 0.04n of customers currently in the market ho did not purchase a doll last year will purchase a doll from Play Things this year. Adding these two provides the mean sales for this year. Then the actual sales this year is normally distributed with this mean and standard deviation equal to 7.5% of the mean. a. Use @RISK to estimate the expected NPV of this project. b. Use the percentiles in @ RISKs output to find an interval such that you are 95% certain that the companys actual NPV will be within this interval.Stock market analysts are continually looking for reliable predictors of stock prices. Consider the problem of modeling the price per share of electric utility stocks (Y). Two variables thought to influence this stock price are return on average equity (X1) and annual dividend rate (X2). The stock price, returns on equity, and dividend rates on a randomly selected day for 16 electric utility stocks are provided in the file P13_15.xlsx. Estimate a multiple regression equation using the given data. Interpret each of the estimated regression coefficients. Also, interpret the standard error of estimate and the R-square value for these data.

