Listed below are the numbers of years that archbishops and monarchs in a certain country lived after their election or coronation. Assume that the two samples are independent simple random samples selected from normally distributed populations. Do not assume that the population standard deviations are equal. Use a 0.05 significance level to test the claim that the mean longevity for archbishops is less than the mean for monarchs after coronation. All measurements are in years. E Click the icon to view the table of longevities of archbishops and monarchs. What are the null and alternative hypotheses? Assume that population 1 consists of the longevity of archbishops and population 2 consists of the longevity of monarchs. O A. Ho: H1 S 42 H:H1>H2 O B. Ho: H1 H2 H1: H1 > H2 D. Ho: H1 = H2 O C. Ho: H1 =#2 H: H1 # H2 H1: H1
Listed below are the numbers of years that archbishops and monarchs in a certain country lived after their election or coronation. Assume that the two samples are independent simple random samples selected from normally distributed populations. Do not assume that the population standard deviations are equal. Use a 0.05 significance level to test the claim that the mean longevity for archbishops is less than the mean for monarchs after coronation. All measurements are in years. E Click the icon to view the table of longevities of archbishops and monarchs. What are the null and alternative hypotheses? Assume that population 1 consists of the longevity of archbishops and population 2 consists of the longevity of monarchs. O A. Ho: H1 S 42 H:H1>H2 O B. Ho: H1 H2 H1: H1 > H2 D. Ho: H1 = H2 O C. Ho: H1 =#2 H: H1 # H2 H1: H1

MATLAB: An Introduction with Applications
6th Edition
ISBN:9781119256830
Author:Amos Gilat
Publisher:Amos Gilat
Chapter1: Starting With Matlab
Section: Chapter Questions
Problem 1P

Related questions
Question
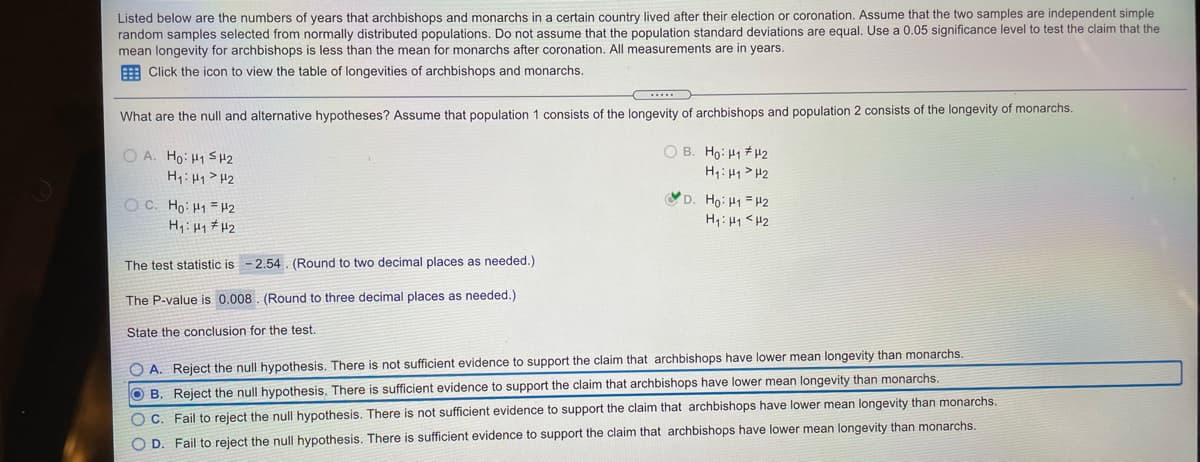
Transcribed Image Text:Listed below are the numbers of years that archbishops and monarchs in a certain country lived after their election or coronation. Assume that the two samples are independent simple
random samples selected from normally distributed populations. Do not assume that the population standard deviations are equal. Use a 0.05 significance level to test the claim that the
mean longevity for archbishops is less than the mean for monarchs after coronation. All measurements are in years.
E Click the icon to view the table of longevities of archbishops and monarchs.
What are the null and alternative hypotheses? Assume that population 1 consists of the longevity of archbishops and population 2 consists of the longevity of monarchs.
O A. Ho: H1 S 42
O B. Ho: H1 # H2
H1:H1>H2
O C. Ho: H1 = H2
H: Hq # H2
D. Ho: H1 = H2
H: 41 <H2
The test statistic is - 2.54 . (Round to two decimal places as needed.)
The P-value is 0.008. (Round to three decimal places as needed.)
State the conclusion for the test.
O A. Reject the null hypothesis. There is not sufficient evidence to support the claim that archbishops have lower mean longevity than monarchs.
OB. Reject the null hypothesis. There is sufficient evidence to support the claim that archbishops have lower mean longevity than monarchs.
OC. Fail to reject the null hypothesis. There is not sufficient evidence to support the claim that archbishops have lower mean longevity than monarchs.
O D. Fail to reject the null hypothesis. There is sufficient evidence to support the claim that archbishops have lower mean longevity than monarchs.
Expert Solution
This question has been solved!
Explore an expertly crafted, step-by-step solution for a thorough understanding of key concepts.

This is a popular solution!

Trending now
This is a popular solution!

Step by step
Solved in 2 steps with 2 images

Recommended textbooks for you
MATLAB: An Introduction with Applications
Statistics
ISBN:
9781119256830
Author:
Amos Gilat
Publisher:
John Wiley & Sons Inc

Probability and Statistics for Engineering and th…
Statistics
ISBN:
9781305251809
Author:
Jay L. Devore
Publisher:
Cengage Learning

Statistics for The Behavioral Sciences (MindTap C…
Statistics
ISBN:
9781305504912
Author:
Frederick J Gravetter, Larry B. Wallnau
Publisher:
Cengage Learning
MATLAB: An Introduction with Applications
Statistics
ISBN:
9781119256830
Author:
Amos Gilat
Publisher:
John Wiley & Sons Inc
Probability and Statistics for Engineering and th…
Statistics
ISBN:
9781305251809
Author:
Jay L. Devore
Publisher:
Cengage Learning
Statistics for The Behavioral Sciences (MindTap C…
Statistics
ISBN:
9781305504912
Author:
Frederick J Gravetter, Larry B. Wallnau
Publisher:
Cengage Learning

Elementary Statistics: Picturing the World (7th E…
Statistics
ISBN:
9780134683416
Author:
Ron Larson, Betsy Farber
Publisher:
PEARSON

The Basic Practice of Statistics
Statistics
ISBN:
9781319042578
Author:
David S. Moore, William I. Notz, Michael A. Fligner
Publisher:
W. H. Freeman

Introduction to the Practice of Statistics
Statistics
ISBN:
9781319013387
Author:
David S. Moore, George P. McCabe, Bruce A. Craig
Publisher:
W. H. Freeman