Listed below are the numbers of years that archbishops and monarchs in a certain country lived after their election or coronation. Assume that the two samples are independent simple random samples selected from normally distribut populations. Do not assume that the population standard deviations are equal. Use a 0.05 significance level to test the claim that the mean longevity for archbishops is less than the mean for monarchs after coronation. All measureme years. E Click the icon to view the table of longevities of archbishops and monarchs. What are the null and alternative hypotheses? Assume that population 1 consists of the longevity of archbishops and population 2 consists of the longevity of monarchs. O A. Ho: H1 #µ2 O B. Ho: H1 =42 H1: H1> H2 H: H1 # H2 c. Họ: H1 =42 O D. Ho: H1 S H2 H1: H1> H2 The test statistic is. (Round to two decimal places as needed.)
Listed below are the numbers of years that archbishops and monarchs in a certain country lived after their election or coronation. Assume that the two samples are independent simple random samples selected from normally distribut populations. Do not assume that the population standard deviations are equal. Use a 0.05 significance level to test the claim that the mean longevity for archbishops is less than the mean for monarchs after coronation. All measureme years. E Click the icon to view the table of longevities of archbishops and monarchs. What are the null and alternative hypotheses? Assume that population 1 consists of the longevity of archbishops and population 2 consists of the longevity of monarchs. O A. Ho: H1 #µ2 O B. Ho: H1 =42 H1: H1> H2 H: H1 # H2 c. Họ: H1 =42 O D. Ho: H1 S H2 H1: H1> H2 The test statistic is. (Round to two decimal places as needed.)

Algebra and Trigonometry (MindTap Course List)
4th Edition
ISBN:9781305071742
Author:James Stewart, Lothar Redlin, Saleem Watson
Publisher:James Stewart, Lothar Redlin, Saleem Watson
Chapter14: Counting And Probability
Section14.CT: Chapter Test
Problem 7CT: An anagram of a word is a rearrangement of the letters of the word. a How many anagrams of the word...

Related questions
Topic Video
Question
please help solve below questions pertaining to attached image
find the test statisitic
find the p value
State the conclusion for the test.
A. Reject the null hypothesis. There is sufficient evidence to support the claim that archbishops have lower mean longevity than monarchs.
D. Reject the null hypothesis. There is not sufficient evidence to support the claim that archbishops have lower mean longevity than monarchs.
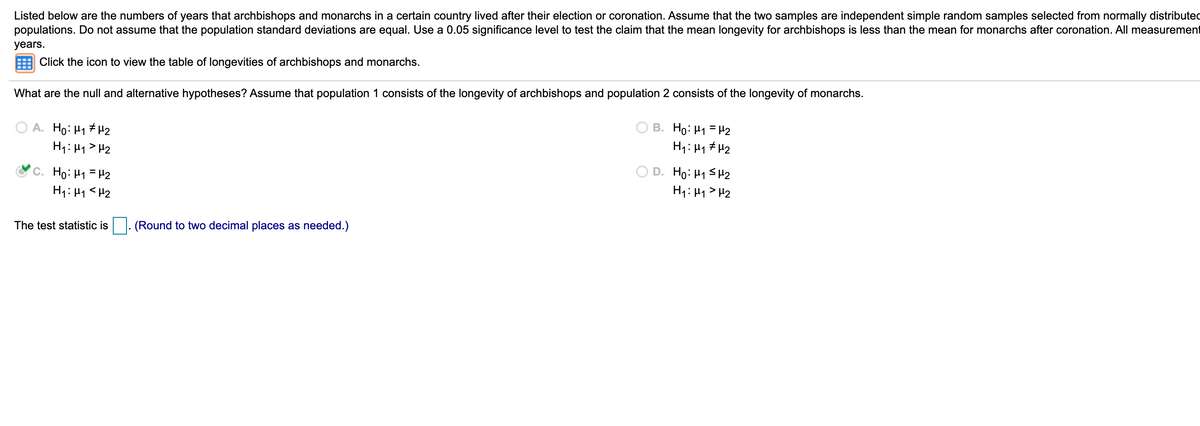
Transcribed Image Text:Listed below are the numbers of years that archbishops and monarchs in a certain country lived after their election or coronation. Assume that the two samples are independent simple random samples selected from normally distributec
populations. Do not assume that the population standard deviations are equal. Use a .05 significance level to test the claim that the mean longevity for archbishops is less than the mean for monarchs after coronation. All measurement
years.
Click the icon to view the table of longevities of archbishops and monarchs.
What are the null and alternative hypotheses? Assume that population 1 consists of the longevity of archbishops and population 2 consists of the longevity of monarchs.
A. Ho: H1 # H2
H1: H1> H2
B. Ho: H1 = H2
H1: H1 # H2
C. Ho: H1 = H2
H1: H1 <H2
D. Ho: H1 SH2
H1: 41 > H2
The test statistic is
(Round to two decimal places as needed.)
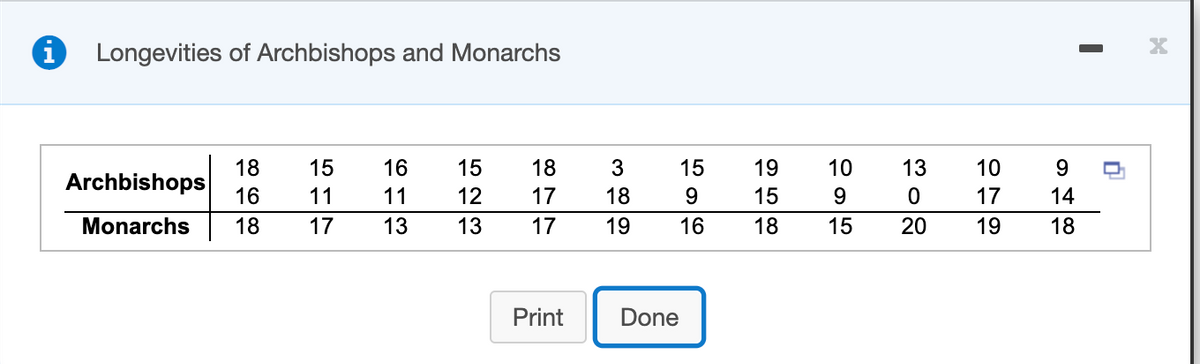
Transcribed Image Text:Longevities of Archbishops and Monarchs
18
Archbishops
15
16
15
18
3
15
19
10
13
10
9.
16
11
11
12
17
18
9.
9.
17
14
Monarchs
18
17
13
13
17
19
16
18
15
20
19
18
Print
Done
O 500
Expert Solution
This question has been solved!
Explore an expertly crafted, step-by-step solution for a thorough understanding of key concepts.

This is a popular solution!

Trending now
This is a popular solution!

Step by step
Solved in 2 steps with 3 images

Knowledge Booster


Learn more about
Need a deep-dive on the concept behind this application? Look no further. Learn more about this topic, statistics and related others by exploring similar questions and additional content below.Recommended textbooks for you
Algebra and Trigonometry (MindTap Course List)
Algebra
ISBN:
9781305071742
Author:
James Stewart, Lothar Redlin, Saleem Watson
Publisher:
Cengage Learning


College Algebra
Algebra
ISBN:
9781305115545
Author:
James Stewart, Lothar Redlin, Saleem Watson
Publisher:
Cengage Learning
Algebra and Trigonometry (MindTap Course List)
Algebra
ISBN:
9781305071742
Author:
James Stewart, Lothar Redlin, Saleem Watson
Publisher:
Cengage Learning
College Algebra
Algebra
ISBN:
9781305115545
Author:
James Stewart, Lothar Redlin, Saleem Watson
Publisher:
Cengage Learning

Glencoe Algebra 1, Student Edition, 9780079039897…
Algebra
ISBN:
9780079039897
Author:
Carter
Publisher:
McGraw Hill

College Algebra (MindTap Course List)
Algebra
ISBN:
9781305652231
Author:
R. David Gustafson, Jeff Hughes
Publisher:
Cengage Learning