Listed in the data table are IQ scores for a random sample of subjects with medium lead levels in their blood. Also listed are statistics from a study done of IQ scores for a random sample of subjects with high lead levels. Assume that the two samples are independent simple random samples selected from normally distributed populations. Do not assume that the population standard deviations are equal. Use a 0.01 significance level. E Click the icon to view the data table of IQ scores. Test the claim that the mean IQ scores for subjects with medium lead levels is higher than the mean for subjects with high lead levels. What are the null and alternative hypotheses? Assume that population 1 consists of subjects with medium lead levels and population 2 consists of subjects with high lead levels. O A. Ho: H1 H2 H: H1> H2 O B. Ho: H1 SH2 H: H1>H2 OC. Ho: H1 = H2 O D. Ho: H1 = H2 IQ Scores The test statistic is (Round to two decimal places as needed.) The P-value is (Round to three decimal places as needed.) Medium Lead Level O High Lead Level State the conclusion for the test. 72 n2 = 11 81 92 O A. Reject the null hypothesis. There is sufficient evidence to support the claim that subjects with mediur X2 = 87.308 O B. Reject the null hypothesis. There is not sufficient evidence to support the claim that subjects with me $2 = 10.578 OC. Fail to reject the null hypothesis. There is sufficient evidence to support the claim that subjects with r 83 O D. Fail to reject the null hypothesis. There is not sufficient evidence to support the claim that subjects w 92 100
Listed in the data table are IQ scores for a random sample of subjects with medium lead levels in their blood. Also listed are statistics from a study done of IQ scores for a random sample of subjects with high lead levels. Assume that the two samples are independent simple random samples selected from normally distributed populations. Do not assume that the population standard deviations are equal. Use a 0.01 significance level. E Click the icon to view the data table of IQ scores. Test the claim that the mean IQ scores for subjects with medium lead levels is higher than the mean for subjects with high lead levels. What are the null and alternative hypotheses? Assume that population 1 consists of subjects with medium lead levels and population 2 consists of subjects with high lead levels. O A. Ho: H1 H2 H: H1> H2 O B. Ho: H1 SH2 H: H1>H2 OC. Ho: H1 = H2 O D. Ho: H1 = H2 IQ Scores The test statistic is (Round to two decimal places as needed.) The P-value is (Round to three decimal places as needed.) Medium Lead Level O High Lead Level State the conclusion for the test. 72 n2 = 11 81 92 O A. Reject the null hypothesis. There is sufficient evidence to support the claim that subjects with mediur X2 = 87.308 O B. Reject the null hypothesis. There is not sufficient evidence to support the claim that subjects with me $2 = 10.578 OC. Fail to reject the null hypothesis. There is sufficient evidence to support the claim that subjects with r 83 O D. Fail to reject the null hypothesis. There is not sufficient evidence to support the claim that subjects w 92 100

Glencoe Algebra 1, Student Edition, 9780079039897, 0079039898, 2018
18th Edition
ISBN:9780079039897
Author:Carter
Publisher:Carter
Chapter10: Statistics
Section10.4: Distributions Of Data
Problem 19PFA

Related questions

Question
Listed in the data table are IQ scores for a random sample of subjects with medium lead levels in their blood. Also listed are statistics from a study done of IQ scores for a random sample of subjects with high lead levels. Assume that the two samples are independent simple random samples selected from
0.01
significance level.
Transcribed Image Text:Listed in the data table are IQ scores for a random sample of subjects with medium lead levels in their blood. Also listed are statistics from a study done of IQ scores for a random sample of subjects with
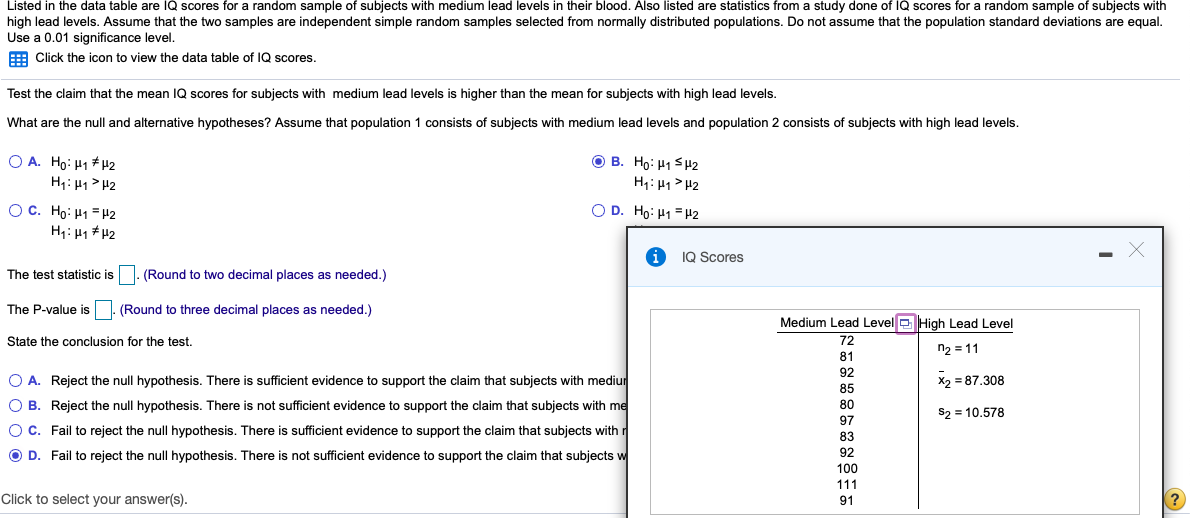
high lead levels. Assume that the two samples are independent simple random samples selected from normally distributed populations. Do not assume that the population standard deviations are equal.
Use a 0.01 significance level.
E Click the icon to view the data table of lQ scores.
Test the claim that the mean IQ scores for subjects with medium lead levels is higher than the mean for subjects with high lead levels.
What are the null and alternative hypotheses? Assume that population 1 consists of subjects with medium lead levels and population 2 consists of subjects with high lead levels.
O A. Ho: H1 # H2
H: H1> H2
O B. Ho: H1 SH2
H1: H1 > H2
OC. Ho: H1 = H2
O D. Ho: H1 = H2
H1: H1 + 42
IQ Scores
The test statistic is
(Round to two decimal places as needed.)
The P-value is
(Round to three decimal places as needed.)
Medium Lead Level D High Lead Level
State the conclusion for the test.
72
ウ=11
81
92
O A. Reject the null hypothesis. There is sufficient evidence to support the claim that subjects with mediur
X2 = 87.308
O B. Reject the null hypothesis. There is not sufficient evidence to support the claim that subjects with me
S2 = 10.578
Oc. Fail to reject the null hypothesis. There is sufficient evidence to support the claim that subjects with r
O D. Fail to reject the null hypothesis. There is not sufficient evidence to support the claim that subjects w
92
100
111
Click to select your answer(s).
91
Expert Solution
This question has been solved!
Explore an expertly crafted, step-by-step solution for a thorough understanding of key concepts.

This is a popular solution!

Trending now
This is a popular solution!

Step by step
Solved in 4 steps

Knowledge Booster


Learn more about
Need a deep-dive on the concept behind this application? Look no further. Learn more about this topic, statistics and related others by exploring similar questions and additional content below.Recommended textbooks for you
Glencoe Algebra 1, Student Edition, 9780079039897…
Algebra
ISBN:
9780079039897
Author:
Carter
Publisher:
McGraw Hill
Glencoe Algebra 1, Student Edition, 9780079039897…
Algebra
ISBN:
9780079039897
Author:
Carter
Publisher:
McGraw Hill