Look at the two histograms below. Each involves the same number of data. The data are all whole numbers, so the height of each bar represents the number of values equal to the corresponding midpoint shown on the horizontal axis. Notice that both distributions are symmetric. (i) (ii) 4 4 3 3 2 1+ 1 4 6 7 9 10 4 7 8 9 10 (a) Estimate the mode, median, and mean for each histogram. (ii) (i) mode median mean (b) Which distribution has the larger standard deviation? Why? O Distribution (i), because more of the data are farther from the mean. O Distribution (ii), because more of the data are farther from the mean. O Distribution (i), because more of the data are closer to the mean. O Distribution (ii), because more of the data are closer to the mean. kouenbes


Inverse Normal Distribution
The method used for finding the corresponding z-critical value in a normal distribution using the known probability is said to be an inverse normal distribution. The inverse normal distribution is a continuous probability distribution with a family of two parameters.
Mean, Median, Mode
It is a descriptive summary of a data set. It can be defined by using some of the measures. The central tendencies do not provide information regarding individual data from the dataset. However, they give a summary of the data set. The central tendency or measure of central tendency is a central or typical value for a probability distribution.
Z-Scores
A z-score is a unit of measurement used in statistics to describe the position of a raw score in terms of its distance from the mean, measured with reference to standard deviation from the mean. Z-scores are useful in statistics because they allow comparison between two scores that belong to different normal distributions.
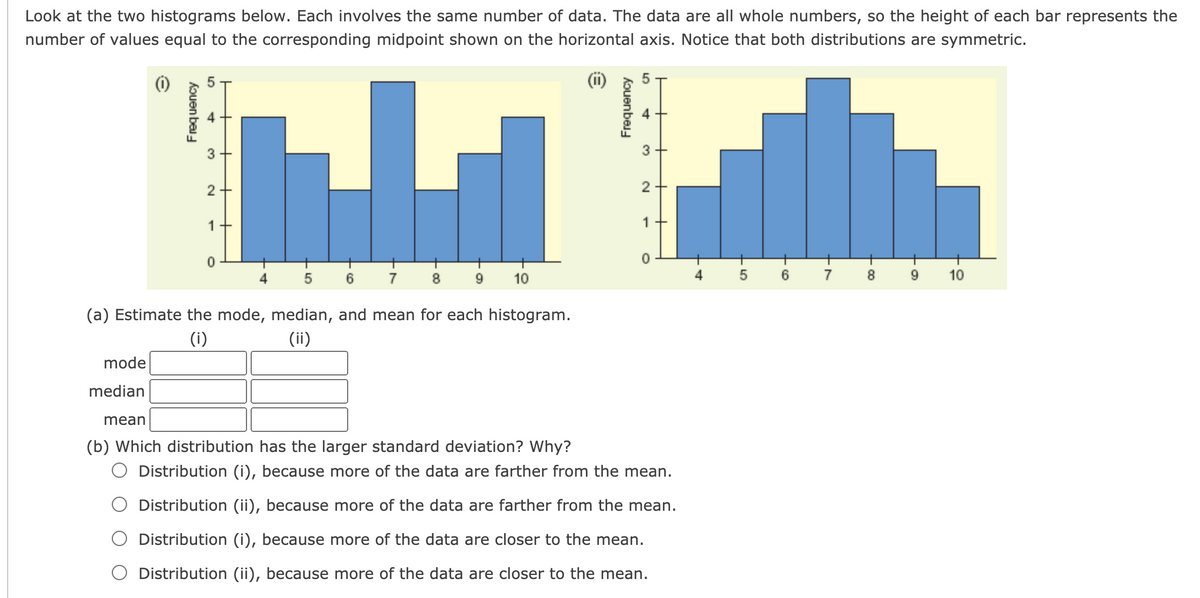
The provided histogram displays a symmetrical distribution of data.
If the data are symmetric, they have about the same shape on either side of the middle. In other words, if you fold the histogram in half, it looks about the same on both sides. Histogram in the figure shows the mean and median are close together.
A distribution is symmetrical if a vertical line can be drawn at some point in the histogram such that the shape to the left and the right of the vertical line are mirror images of each other.
The mean, the median, and the mode are each seven for these data.
| (i) | (ii) | |
| Mean | 7 | 7 |
| Median | 7 | 7 |
| Mode | 7 | 7 |

Trending now
This is a popular solution!

Step by step
Solved in 2 steps


