MAarison of student's performance involved the total of n = 600 respondents. Two groups selected were: MLATH majors and and Computer Science majors. Individual performance was measured in a binary scale (ABOVE or BELOW average). The summaries are presented below. %3D Group Size ABOVE Proportion MATH X1 = 140 (f)1 = 140/200 = 0.7 %3D %3D n1 = 200 COMP Science X2 = 310 (p)2 = 310/400 = 0.775 %3D n2 = 400 %3D Pooled n = n1 + n2 = 600 X = X+X2 = 450 p = 450/600 = 0.75 %3D %3D %3D At the significance level, a = 0.05, do you have sufficient evidence that population proportions DIFFER? • Evaluate the test statistic • Specify critical value (or values) needed for this procedure. • State the Rejection Rule • Formulate your decision
MAarison of student's performance involved the total of n = 600 respondents. Two groups selected were: MLATH majors and and Computer Science majors. Individual performance was measured in a binary scale (ABOVE or BELOW average). The summaries are presented below. %3D Group Size ABOVE Proportion MATH X1 = 140 (f)1 = 140/200 = 0.7 %3D %3D n1 = 200 COMP Science X2 = 310 (p)2 = 310/400 = 0.775 %3D n2 = 400 %3D Pooled n = n1 + n2 = 600 X = X+X2 = 450 p = 450/600 = 0.75 %3D %3D %3D At the significance level, a = 0.05, do you have sufficient evidence that population proportions DIFFER? • Evaluate the test statistic • Specify critical value (or values) needed for this procedure. • State the Rejection Rule • Formulate your decision

Glencoe Algebra 1, Student Edition, 9780079039897, 0079039898, 2018
18th Edition
ISBN:9780079039897
Author:Carter
Publisher:Carter
Chapter10: Statistics
Section10.3: Measures Of Spread
Problem 1GP

Related questions
Question
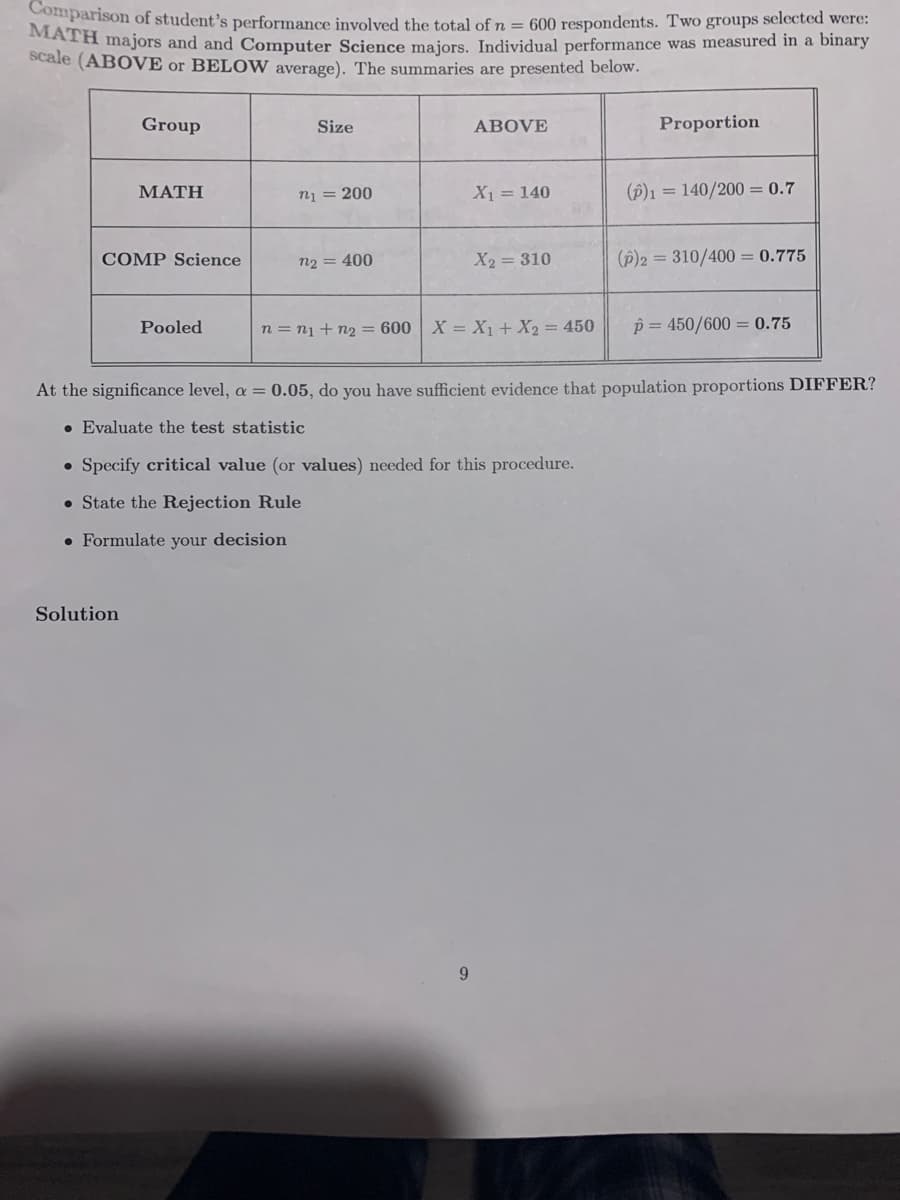
Transcribed Image Text:MAparison of student's performance involved the total of n = 600 respondents. Two groups selected were:
a majors and and Computer Science majors. Individual performance was measured in a binary
scale (ABOVE or BELOVW average). The summaries are presented below.
Group
Size
ABOVE
Proportion
MATH
X1 = 140
(Đ)1 = 140/200 = 0.7
n1 = 200
COMP Science
n2 = 400
X2 = 310
(p)2 = 310/400 = 0.775
Pooled
n = nị + n2 = 600 X = X1 + X2 = 450
p = 450/600 = 0.75
At the significance level, a = 0.05, do you have sufficient evidence that population proportions DIFFER?
• Evaluate the test statistic
• Specify critical value (or values) needed for this procedure.
• State the Rejection Rule
• Formulate your decision
Solution
9.
Expert Solution
This question has been solved!
Explore an expertly crafted, step-by-step solution for a thorough understanding of key concepts.

This is a popular solution!

Trending now
This is a popular solution!

Step by step
Solved in 5 steps

Recommended textbooks for you
Glencoe Algebra 1, Student Edition, 9780079039897…
Algebra
ISBN:
9780079039897
Author:
Carter
Publisher:
McGraw Hill

Glencoe Algebra 1, Student Edition, 9780079039897…
Algebra
ISBN:
9780079039897
Author:
Carter
Publisher:
McGraw Hill