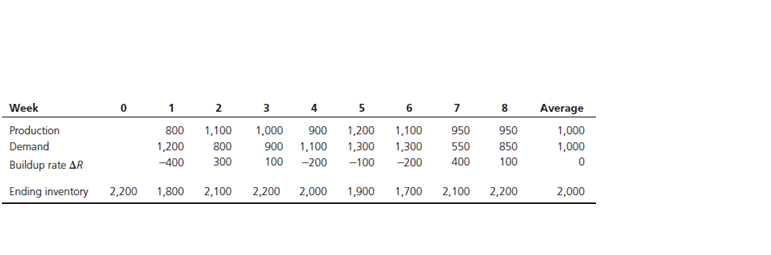
MBPF Inc. manufactures prefabricated garages. The manufacturing facility purchases sheet metal that is formed and assembled into finished products—garages. Each garage needs a roof and a base, and both components are punched out of separate metal sheets prior to assembly. Production and demand data for the past eight weeks are shown in Table below. Observe that both production and demand vary from week to week. Now, track the inventory at the end of each week, measured in number of finished garages. Also, construct the inventory build-up diagram. MBPF Inc. manufactures prefabricated garages. The manufacturing facility purchases sheet metal that is formed and assembled into finished products—garages. Each garage needs a roof and a base, and both components are punched out of separate metal sheets prior to assembly. Production and demand data for the past eight weeks are shown in Table below. Observe that both production and demand vary from week to week. Now, track the inventory at the end of each week, measured in number of finished garages In the above problem, suppose that in terms of material and labor, each garage costs $3,300 to produce. Calculate the following: Calculate throughput, by considering garage as the flow unit Calculate throughput, by considering each dollar spent as the flow Calculate average inventory, by considering garage as the flow Calculate average inventory, by considering each dollar spent as the flow Calculate the average flow time of a garage, or of a dollar tied up in each


. MBPF Inc. manufactures prefabricated garages. The manufacturing facility purchases sheet metal that is formed and assembled into finished products—garages. Each garage needs a roof and a base, and both components are punched out of separate metal sheets prior to assembly. Production and demand data for the past eight weeks are shown in Table below. Observe that both production and demand vary from week to week. Now, track the inventory at the end of each week, measured in number of finished garages. Also, construct the inventory build-up diagram. MBPF Inc. manufactures prefabricated garages. The manufacturing facility purchases sheet metal that is formed and assembled into finished products—garages. Each garage needs a roof and a base, and both components are punched out of separate metal sheets prior to assembly. Production and demand data for the past eight weeks are shown in Table
below. Observe that both production and demand vary from week to week. Now, track the inventory at the end of each week, measured in number of finished garages
In the above problem, suppose that in terms of material and labor, each garage costs $3,300 to produce. Calculate the following:
- Calculate throughput, by considering garage as the flow unit
- Calculate throughput, by considering each dollar spent as the flow
- Calculate average inventory, by considering garage as the flow
- Calculate average inventory, by considering each dollar spent as the flow
- Calculate the average flow time of a garage, or of a dollar tied up in each


Trending now
This is a popular solution!

Step by step
Solved in 3 steps
