Mist (airborne droplets or aerosols) is generated when metal-removing fluids are used in machining operations to com lubricate the tool and workpiece. Mist generation is a concern to OSHA, which has recently lowered substantially the workplace standard. An article gave the accompanying data on x = fluid-flow velocity for a 5% soluble oil (cm/sec) a y the extent of mist droplets having diameters smaller than 10 µm (mg/m³): 367 442 962 *19 y 0.44 0.60 0.47 0.66 0.59 0.69 0.98 (a) The investigators performed a simple linear regression analysis to relate the two variables. Does a scatter of the data support this strategy? Yes, a scatter plot shows a reasonable linear relationship. No, a scatter plot does not show a reasonable linear relationship. 90 177 185 354 (b) What proportion of observed variation in mist can be attributed to the simple linear regression relationship between velocity and mist? (Round your answer to three decimal places.) (c) The investigators were particularly interested in the impact on mist of increasing velocity from 100 to 1000 factor of 10 corresponding to the difference between the smallest and largest x values in the sample). When x increases in this way, is there substantial evidence that the true average increase in y is less than 0.6? (Use a = 0.05.) State the appropriate null and alternative hypotheses. O Ho: P₁ 0.0006667 H₂: P₁ < 0.0006667 O Ho: P1" Ha: ₁ 0.0006667 0.0006667 = 0.0006667 O Ho: P1" H: ₁ 0.0006667 0.0006EET
Mist (airborne droplets or aerosols) is generated when metal-removing fluids are used in machining operations to com lubricate the tool and workpiece. Mist generation is a concern to OSHA, which has recently lowered substantially the workplace standard. An article gave the accompanying data on x = fluid-flow velocity for a 5% soluble oil (cm/sec) a y the extent of mist droplets having diameters smaller than 10 µm (mg/m³): 367 442 962 *19 y 0.44 0.60 0.47 0.66 0.59 0.69 0.98 (a) The investigators performed a simple linear regression analysis to relate the two variables. Does a scatter of the data support this strategy? Yes, a scatter plot shows a reasonable linear relationship. No, a scatter plot does not show a reasonable linear relationship. 90 177 185 354 (b) What proportion of observed variation in mist can be attributed to the simple linear regression relationship between velocity and mist? (Round your answer to three decimal places.) (c) The investigators were particularly interested in the impact on mist of increasing velocity from 100 to 1000 factor of 10 corresponding to the difference between the smallest and largest x values in the sample). When x increases in this way, is there substantial evidence that the true average increase in y is less than 0.6? (Use a = 0.05.) State the appropriate null and alternative hypotheses. O Ho: P₁ 0.0006667 H₂: P₁ < 0.0006667 O Ho: P1" Ha: ₁ 0.0006667 0.0006667 = 0.0006667 O Ho: P1" H: ₁ 0.0006667 0.0006EET

Glencoe Algebra 1, Student Edition, 9780079039897, 0079039898, 2018
18th Edition
ISBN:9780079039897
Author:Carter
Publisher:Carter
Chapter10: Statistics
Section10.1: Measures Of Center
Problem 9PPS

Related questions
Question
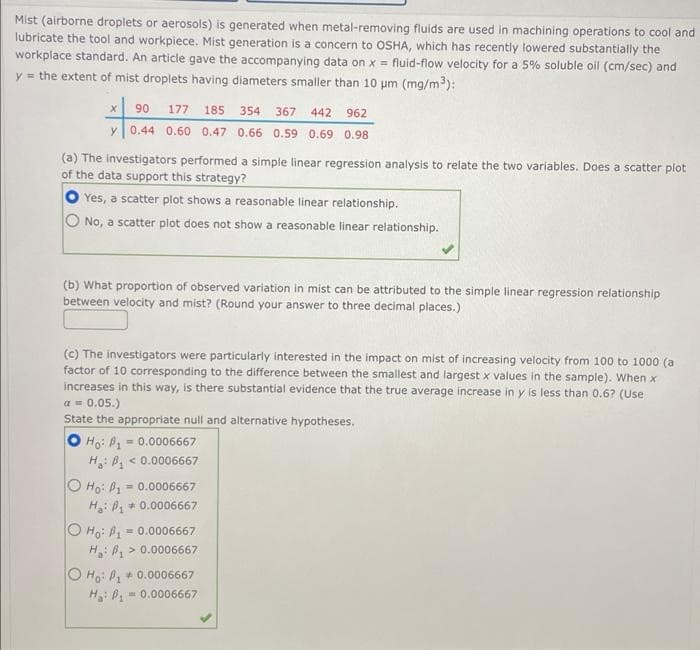
Transcribed Image Text:Mist (airborne droplets or aerosols) is generated when metal-removing fluids are used in machining operations to cool and
lubricate the tool and workpiece. Mist generation is a concern to OSHA, which has recently lowered substantially the
workplace standard. An article gave the accompanying data on x = fluid-flow velocity for a 5% soluble oil (cm/sec) and
y = the extent of mist droplets having diameters smaller than 10 μm (mg/m³):
X 90 177 185 354 367 442 962
y 0.44 0.60 0.47 0.66 0.59 0.69 0.98
(a) The investigators performed a simple linear regression analysis to relate the two variables. Does a scatter plot
of the data support this strategy?
Yes, a scatter plot shows a reasonable linear relationship.
No, a scatter plot does not show a reasonable linear relationship.
(b) What proportion of observed variation in mist can be attributed to the simple linear regression relationship
between velocity and mist? (Round your answer to three decimal places.)
(c) The investigators were particularly interested in the impact on mist of increasing velocity from 100 to 1000 (a
factor of 10 corresponding to the difference between the smallest and largest x values in the sample). When x
increases in this way, is there substantial evidence that the true average increase in y is less than 0.6? (Use
a = 0.05.)
State the appropriate null and alternative hypotheses.
O Ho: ₁ = 0.0006667
H₂: B₁- < 0.0006667
O Ho: P₁=
= 0.0006667
H: ₁0.0006667
O Ho: P1
= 0.0006667
H:₁> 0.0006667
O Ho: P₁ 0.0006667
H₂: P₁
= 0.0006667
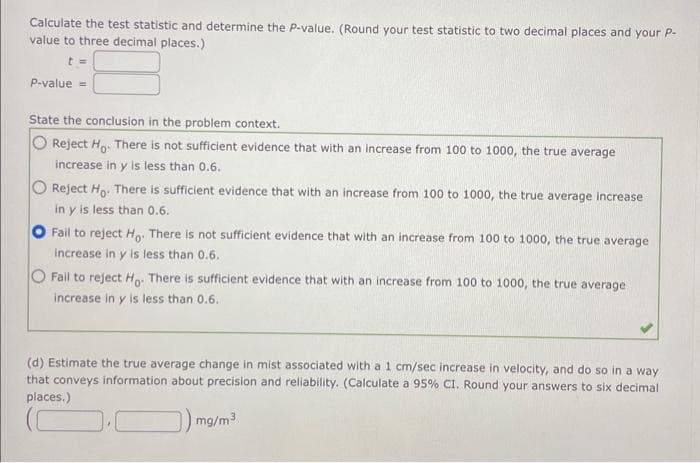
Transcribed Image Text:Calculate the test statistic and determine the P-value. (Round your test statistic to two decimal places and your P-
value to three decimal places.)
t=
P-value =
State the conclusion in the problem context.
Reject Ho. There is not sufficient evidence that with an increase from 100 to 1000, the true average
increase in y is less than 0.6.
O Reject Ho. There is sufficient evidence that with an increase from 100 to 1000, the true average increase
in y is less than 0.6.
Fail to reject Ho. There is not sufficient evidence that with an increase from 100 to 1000, the true average
increase in y is less than 0.6.
O Fail to reject Ho. There is sufficient evidence that with an increase from 100 to 1000, the true average
increase in y is less than 0.6.
(d) Estimate the true average change in mist associated with a 1 cm/sec increase in velocity, and do so in a way
that conveys information about precision and reliability. (Calculate a 95% CI. Round your answers to six decimal
places.)
mg/m³
Expert Solution
This question has been solved!
Explore an expertly crafted, step-by-step solution for a thorough understanding of key concepts.

This is a popular solution!

Trending now
This is a popular solution!

Step by step
Solved in 3 steps with 3 images

Recommended textbooks for you
Glencoe Algebra 1, Student Edition, 9780079039897…
Algebra
ISBN:
9780079039897
Author:
Carter
Publisher:
McGraw Hill
Glencoe Algebra 1, Student Edition, 9780079039897…
Algebra
ISBN:
9780079039897
Author:
Carter
Publisher:
McGraw Hill