Consider the perfectly competitive market for titanium. Assume that, regardless of how many firms are in the industry, every firm in the industry is identical and faces the marginal cost (MC), average total cost (ATC), and average variable cost (AVC) curves shown on the following graph.
Consider the perfectly competitive market for titanium. Assume that, regardless of how many firms are in the industry, every firm in the industry is identical and faces the marginal cost (MC), average total cost (ATC), and average variable cost (AVC) curves shown on the following graph.

Essentials of Economics (MindTap Course List)
8th Edition
ISBN:9781337091992
Author:N. Gregory Mankiw
Publisher:N. Gregory Mankiw
Chapter13: Firms In Competitive Markets
Section: Chapter Questions
Problem 8PA

Related questions
Question
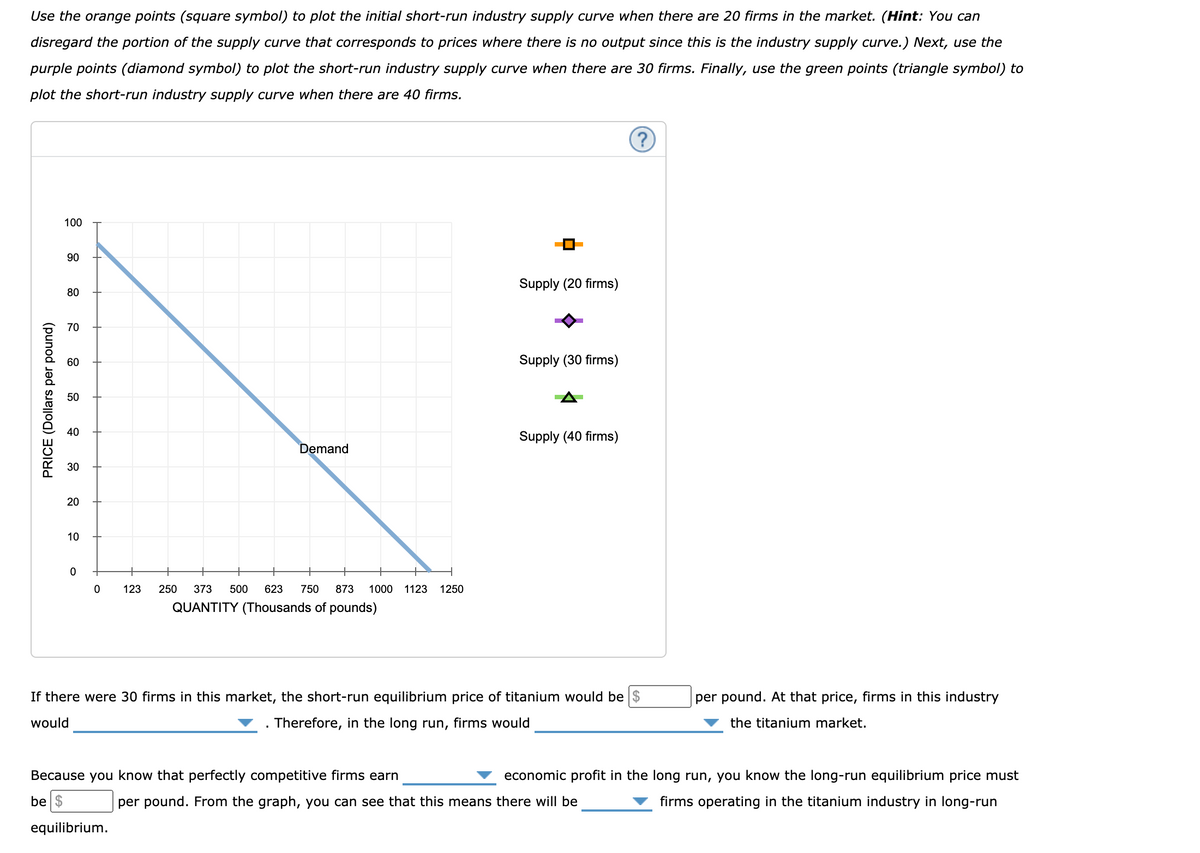
Transcribed Image Text:Use the orange points (square symbol) to plot the initial short-run industry supply curve when there are 20 firms in the market. (Hint: You can
disregard the portion of the supply curve that corresponds to prices where there is no output since this is the industry supply curve.) Next, use the
purple points (diamond symbol) to plot the short-run industry supply curve when there are 30 firms. Finally, use the green points (triangle symbol) to
plot the short-run industry supply curve when there are 40 firms.
100
90
Supply (20 firms)
80
70
60
Supply (30 firms)
50
40
Supply (40 firms)
Demand
30
20
10
+
123
250
373
500
623
750
873
1000
1123
1250
QUANTITY (Thousands of pounds)
If there were 30 firms in this market, the short-run equilibrium price of titanium would be $
per pound. At that price, firms in this industry
would
Therefore, in the long run, firms would
the titanium market.
Because you know that perfectly competitive firms earn
economic profit in the long run, you know the long-run equilibrium price must
be $
per pound. From the graph, you can see that this means there will be
firms operating in the titanium industry in long-run
equilibrium.
PRICE (Dollars per pound)
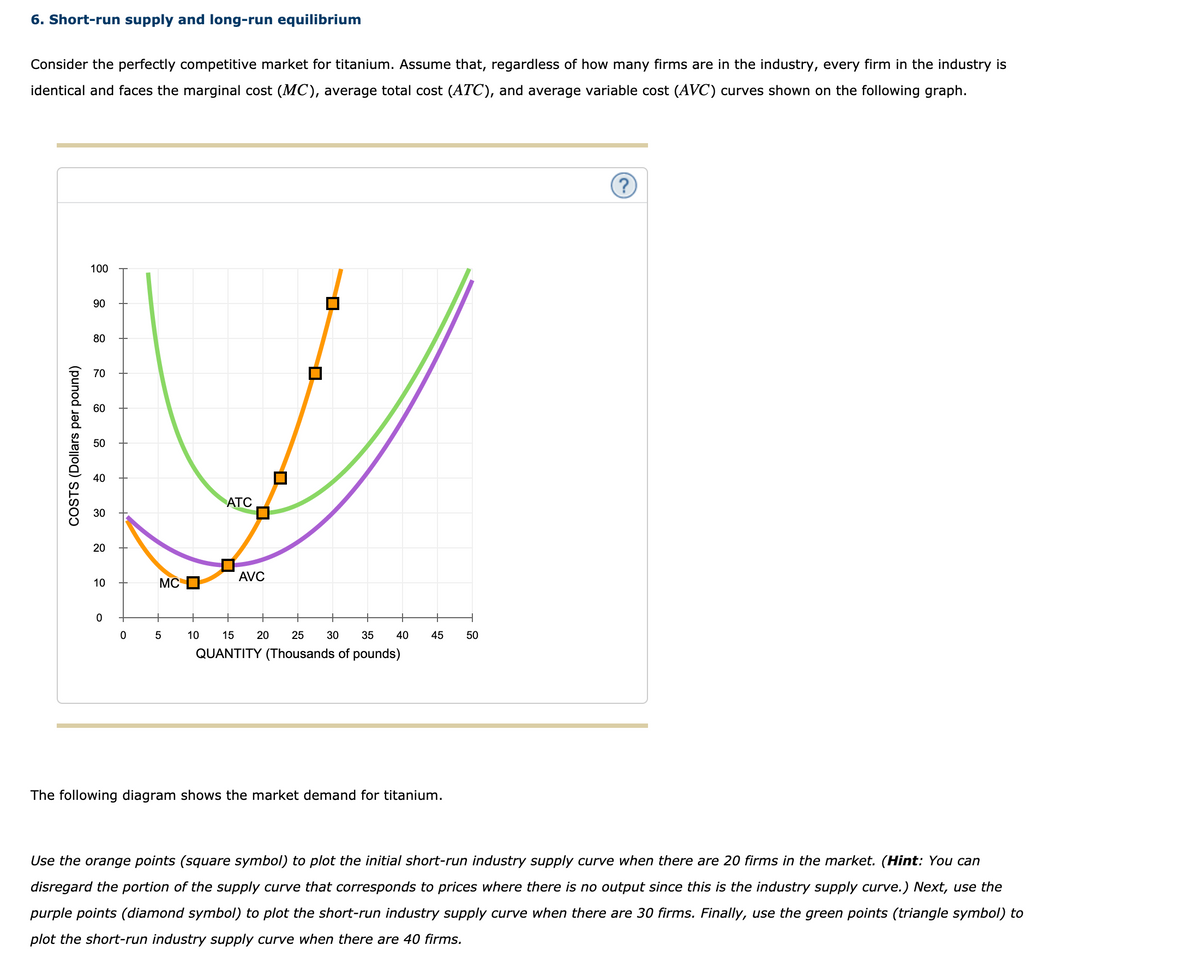
Transcribed Image Text:6. Short-run supply and long-run equilibrium
Consider the perfectly competitive market for titanium. Assume that, regardless of how many firms are in the industry, every firm in the industry is
identical and faces the marginal cost (MC), average total cost (ATC), and average variable cost (AVC) curves shown on the following graph.
(?
100
90
80
70
60
50
40
ATC
30
20
AVC
10
MCO
+
+
+
+
0 5
10
15
20
25
30
35
40
45
50
QUANTITY (Thousands of pounds)
The following diagram shows the market demand for titanium.
Use the orange points (square symbol) to plot the initial short-run industry supply curve when there are 20 firms in the market. (Hint: You can
disregard the portion of the supply curve that corresponds to prices where there is no output since this is the industry supply curve.) Next, use the
purple points (diamond symbol) to plot the short-run industry supply curve when there are 30 firms. Finally, use the green points (triangle symbol) to
plot the short-run industry supply curve when there are 40 firms.
COSTS (Dollars per pound)
Expert Solution
This question has been solved!
Explore an expertly crafted, step-by-step solution for a thorough understanding of key concepts.

This is a popular solution!

Trending now
This is a popular solution!

Step by step
Solved in 3 steps with 5 images

Knowledge Booster


Learn more about
Need a deep-dive on the concept behind this application? Look no further. Learn more about this topic, economics and related others by exploring similar questions and additional content below.Recommended textbooks for you
Essentials of Economics (MindTap Course List)
Economics
ISBN:
9781337091992
Author:
N. Gregory Mankiw
Publisher:
Cengage Learning

Principles of Economics 2e
Economics
ISBN:
9781947172364
Author:
Steven A. Greenlaw; David Shapiro
Publisher:
OpenStax

Principles of Economics (MindTap Course List)
Economics
ISBN:
9781305585126
Author:
N. Gregory Mankiw
Publisher:
Cengage Learning
Essentials of Economics (MindTap Course List)
Economics
ISBN:
9781337091992
Author:
N. Gregory Mankiw
Publisher:
Cengage Learning
Principles of Economics 2e
Economics
ISBN:
9781947172364
Author:
Steven A. Greenlaw; David Shapiro
Publisher:
OpenStax
Principles of Economics (MindTap Course List)
Economics
ISBN:
9781305585126
Author:
N. Gregory Mankiw
Publisher:
Cengage Learning

Principles of Economics, 7th Edition (MindTap Cou…
Economics
ISBN:
9781285165875
Author:
N. Gregory Mankiw
Publisher:
Cengage Learning

Principles of Microeconomics (MindTap Course List)
Economics
ISBN:
9781305971493
Author:
N. Gregory Mankiw
Publisher:
Cengage Learning

Principles of Microeconomics
Economics
ISBN:
9781305156050
Author:
N. Gregory Mankiw
Publisher:
Cengage Learning