What are the null and alternative hypotheses? A. H0: The two variables, x and y, are associated. Ha: The two variables, x and y, are not associated. B. H0: The variable x is dependent upon y. Ha: The variable y is dependent upon x. C. H0: The two variables, x and y, are not associated. Ha: The two variables, x and y, are associated. The P-value is (Round to three decimal places as needed.) What is the conclusion of the independence test? A. Do not reject H0. The data provide sufficient evidence of an association. B. Reject H0. The data provide sufficient evidence of an association. C. Do not reject H0. The data do not provide sufficient evidence of an association. D. Reject H0. The data do not provide sufficient evidence of an association.
What are the null and alternative hypotheses? A. H0: The two variables, x and y, are associated. Ha: The two variables, x and y, are not associated. B. H0: The variable x is dependent upon y. Ha: The variable y is dependent upon x. C. H0: The two variables, x and y, are not associated. Ha: The two variables, x and y, are associated. The P-value is (Round to three decimal places as needed.) What is the conclusion of the independence test? A. Do not reject H0. The data provide sufficient evidence of an association. B. Reject H0. The data provide sufficient evidence of an association. C. Do not reject H0. The data do not provide sufficient evidence of an association. D. Reject H0. The data do not provide sufficient evidence of an association.

College Algebra (MindTap Course List)
12th Edition
ISBN:9781305652231
Author:R. David Gustafson, Jeff Hughes
Publisher:R. David Gustafson, Jeff Hughes
Chapter8: Sequences, Series, And Probability
Section8.7: Probability
Problem 6E: List the sample space of each experiment. Tossing three coins

Related questions
Question
What are the null and alternative hypotheses?
H0:
The two variables,
x
and
y,
are associated.Ha:
The two variables,
x
and
y,
are not associated.H0:
The variable
x
is dependent upon
y.
Ha:
The variable
y
is dependent upon
x.
H0:
The two variables,
x
and
y,
are not associated.Ha:
The two variables,
x
and
y,
are associated.The P-value is
(Round to three decimal places as needed.)
What is the conclusion of the independence test?
Do not reject
H0.
The data
provide
sufficient evidence of an association.Reject
H0.
The data
provide
sufficient evidence of an association.Do not reject
H0.
The data
do not provide
sufficient evidence of an association.Reject
H0.
The data
do not provide
sufficient evidence of an association.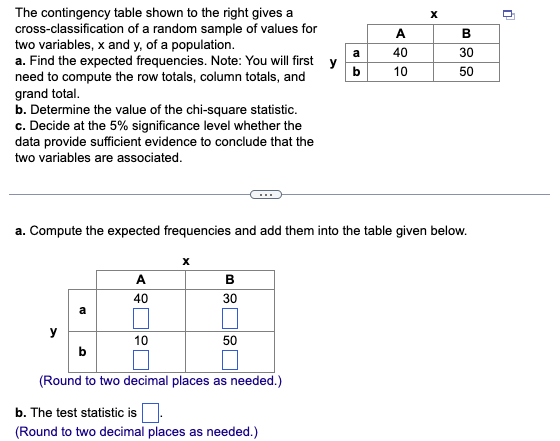
Transcribed Image Text:The contingency table shown to the right gives a
cross-classification of a random sample of values for
two variables, x and y, of a population.
a. Find the expected frequencies. Note: You will first y
need to compute the row totals, column totals, and
grand total.
b. Determine the value of the chi-square statistic.
c. Decide at the 5% significance level whether the
data provide sufficient evidence to conclude that the
two variables are associated.
y
To
A
40
10
a. Compute the expected frequencies and add them into the table given below.
X
B
30
50
b
(Round to two decimal places as needed.)
a
b
b. The test statistic is.
(Round to two decimal places as needed.)
A
40
10
X
B
30
50
n
Expert Solution
This question has been solved!
Explore an expertly crafted, step-by-step solution for a thorough understanding of key concepts.

This is a popular solution!

Trending now
This is a popular solution!

Step by step
Solved in 4 steps with 2 images

Recommended textbooks for you
College Algebra (MindTap Course List)
Algebra
ISBN:
9781305652231
Author:
R. David Gustafson, Jeff Hughes
Publisher:
Cengage Learning
College Algebra (MindTap Course List)
Algebra
ISBN:
9781305652231
Author:
R. David Gustafson, Jeff Hughes
Publisher:
Cengage Learning