Notice that real GDP trends upward over time but experiences ups and downs in the short run. These short-run fluctuations in real GDP are often referred to as True or False: Short-term fluctuations in real GDP are irregular and unpredictable. O True O False Which of the following probably occurred as the U.S. economy experienced declining real GDP in 1957? Check all that apply. O Consumer spending increased. O Corporate profits declined. O Total real income declined. O The unemployment rate increased.
Notice that real GDP trends upward over time but experiences ups and downs in the short run. These short-run fluctuations in real GDP are often referred to as True or False: Short-term fluctuations in real GDP are irregular and unpredictable. O True O False Which of the following probably occurred as the U.S. economy experienced declining real GDP in 1957? Check all that apply. O Consumer spending increased. O Corporate profits declined. O Total real income declined. O The unemployment rate increased.

Chapter11: Gross Domestic Product
Section: Chapter Questions
Problem 4SQ

Related questions
Question
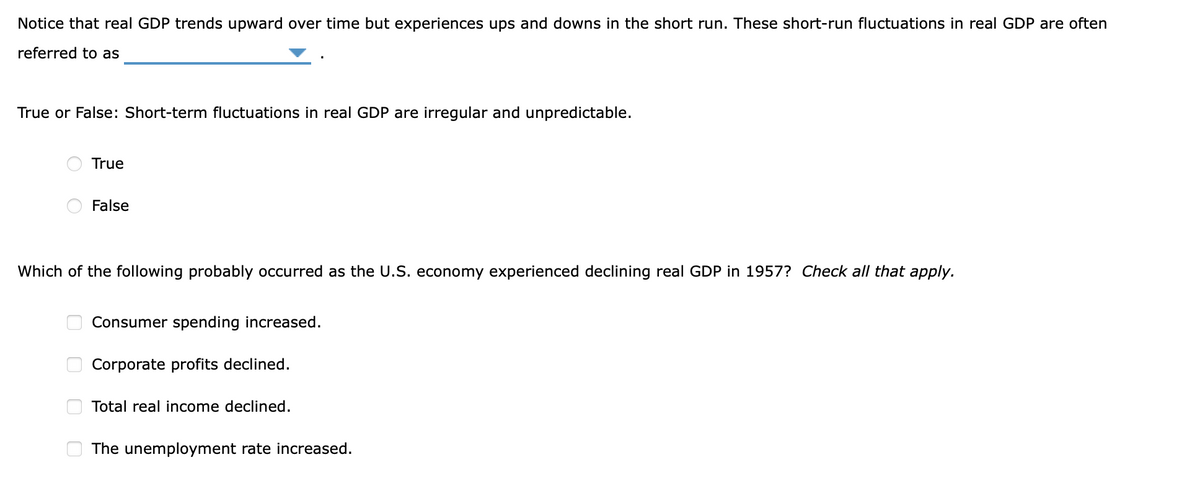
Transcribed Image Text:Notice that real GDP trends upward over time but experiences ups and downs in the short run. These short-run fluctuations in real GDP are often
referred to as
True or False: Short-term fluctuations in real GDP are irregular and unpredictable.
True
False
Which of the following probably occurred as the U.S. economy experienced declining real GDP in 1957? Check all that apply.
Consumer spending increased.
Corporate profits declined.
Total real income declined.
The unemployment rate increased.
O O
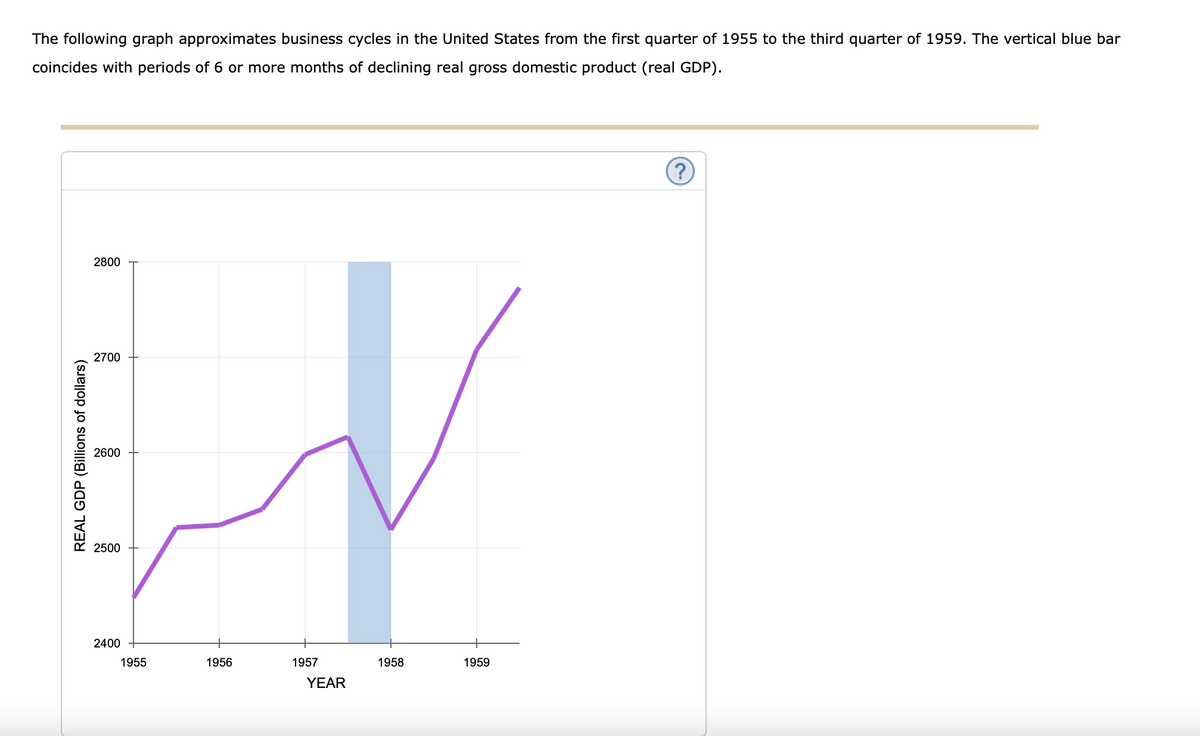
Transcribed Image Text:The following graph approximates business cycles in the United States from the first quarter of 1955 to the third quarter of 1959. The vertical blue bar
coincides with periods of 6 or more months of declining real gross domestic product (real GDP).
2800
2700
2600
2500
2400
1955
1956
1957
1958
1959
YEAR
REAL GDP (Billions of dollars)
Expert Solution
This question has been solved!
Explore an expertly crafted, step-by-step solution for a thorough understanding of key concepts.

This is a popular solution!

Trending now
This is a popular solution!

Step by step
Solved in 5 steps

Knowledge Booster


Learn more about
Need a deep-dive on the concept behind this application? Look no further. Learn more about this topic, economics and related others by exploring similar questions and additional content below.Recommended textbooks for you